Addressing the gap and expanding the addressable user base Splunk Observability Cloud was already being utilized to monitor applications, and infrastructure but lacked comprehensive database monitoring capabilities to provide end-to-end troubleshooting. This gap between application performance and database performance resulted in users switching tools to remediate issues. Customers had also been asking for it on public forums, and we knew from AppDynamics’s success that it was worth ~$50 million in ARR.
Database monitoring would also open up new use cases that target new personas; specifically Database Administrators (DBAs) which would effectively increase the potential market cap for Splunk Observability Cloud.

Designing for scalability I started by understanding the product roadmap, and researching the necessary user needs for database monitoring. It was followed up by laying the groundwork for a scalable information architecture and becoming proficient with Splunk’s design system and UI patterns.
Impact Alpha launch of Database monitoring had 11 customer signups with a conversion rate of 64% within 3 months of launch. This number is currently estimated to grow to 25 by the end of Q1 2026.
Solution
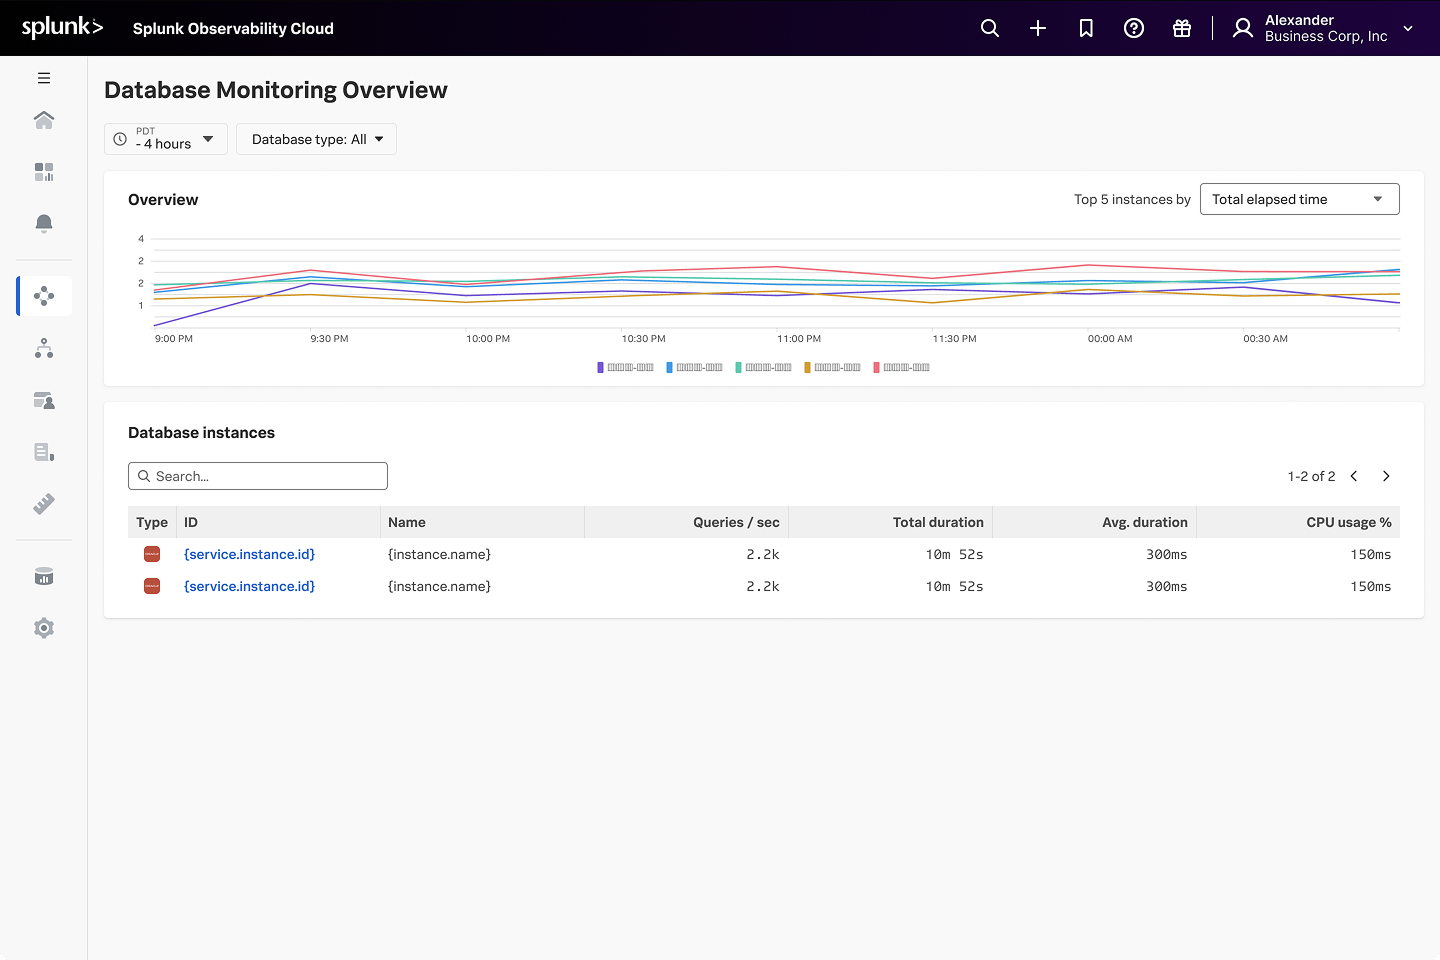
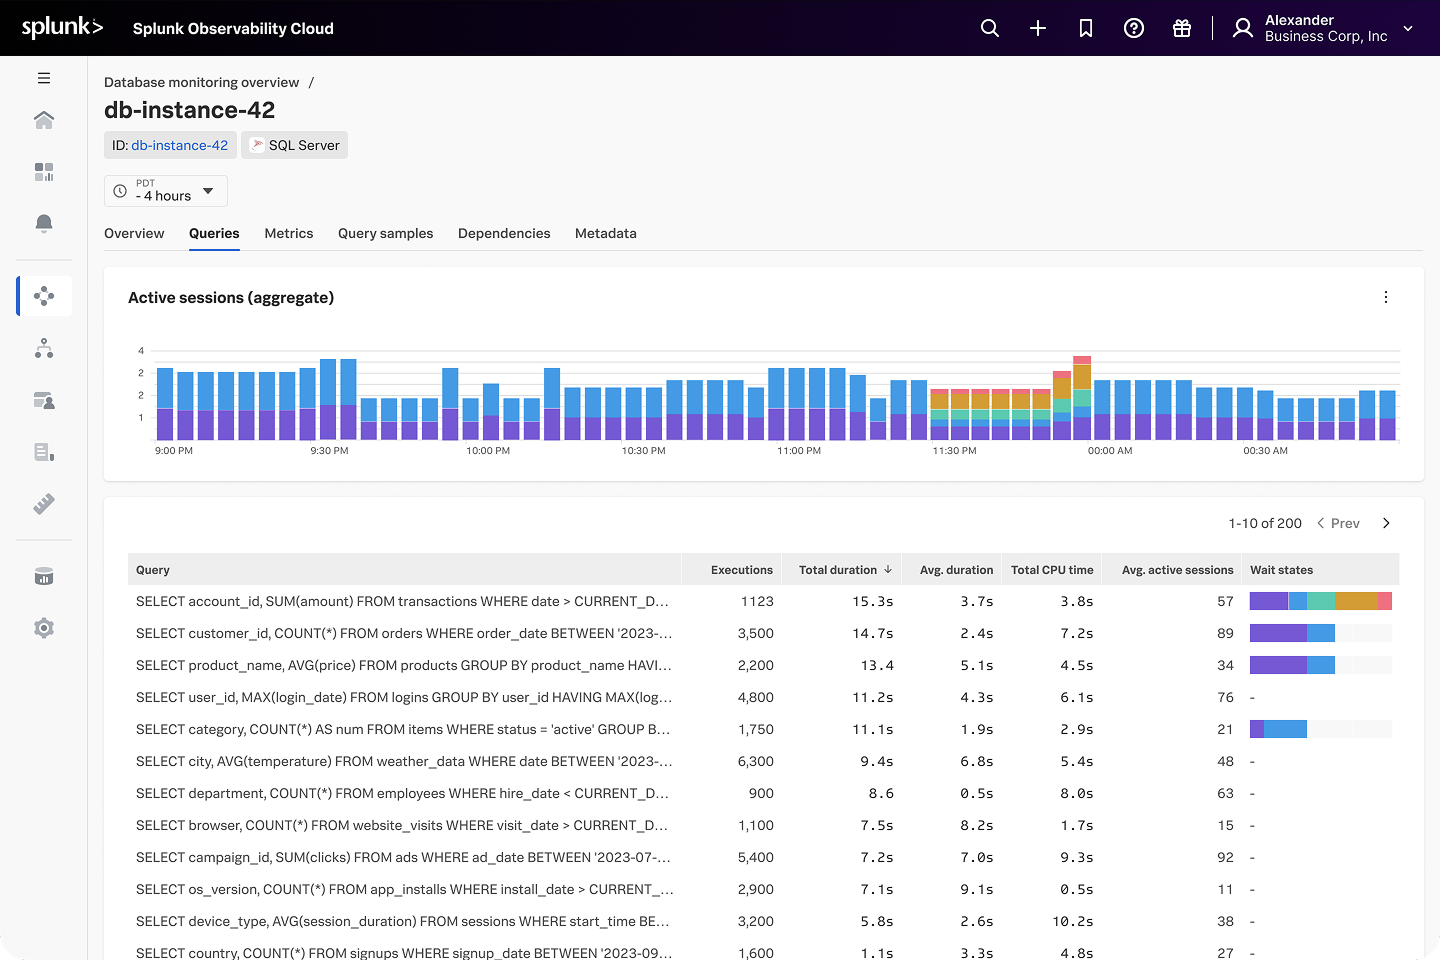
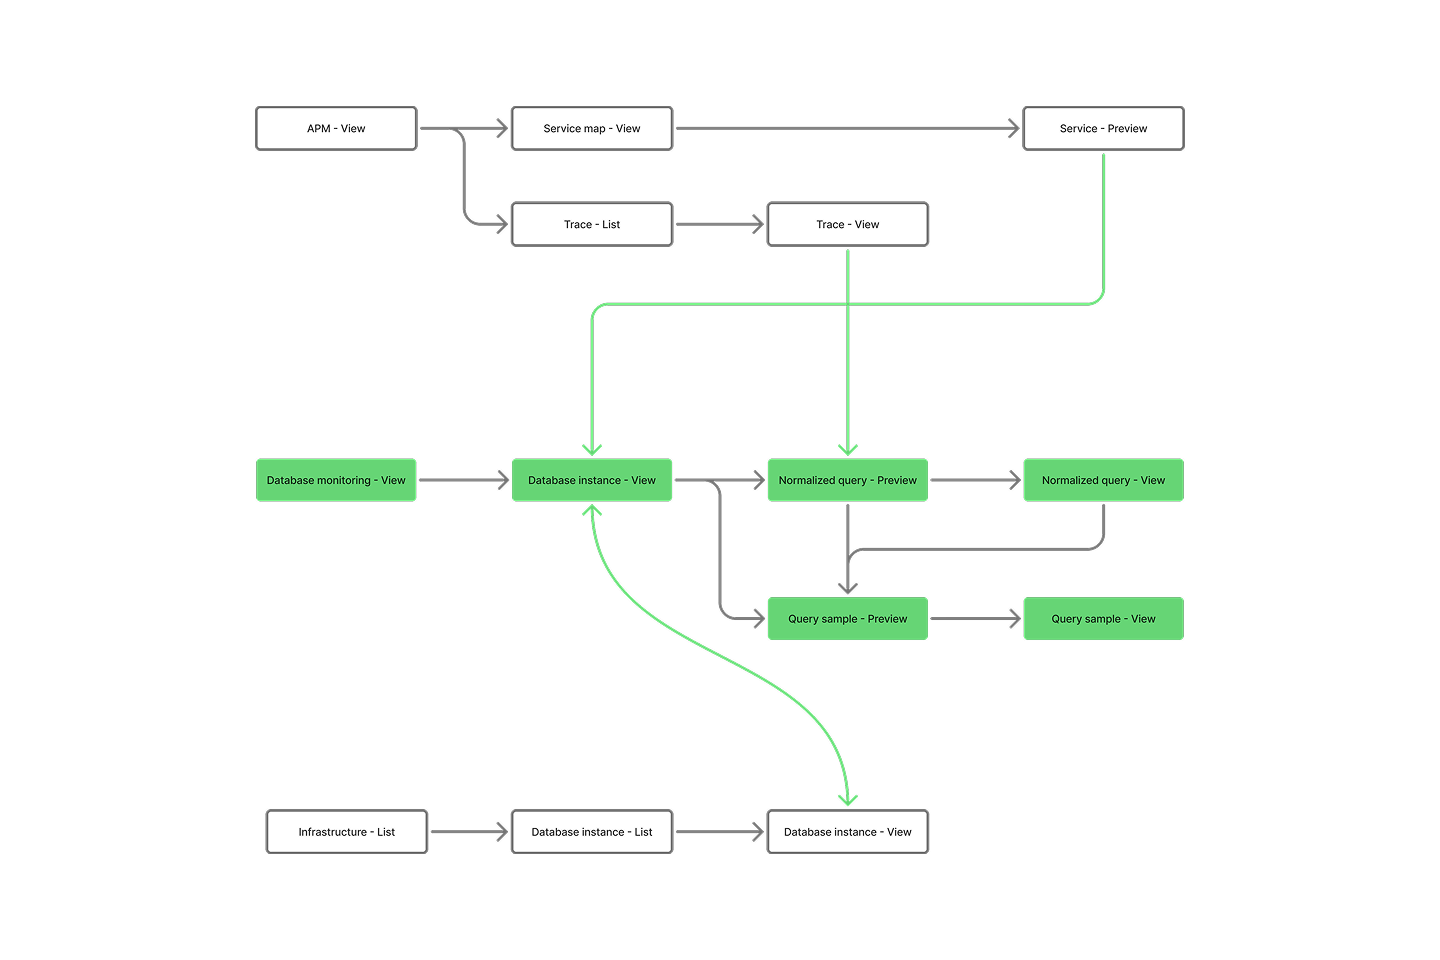
Information architecture
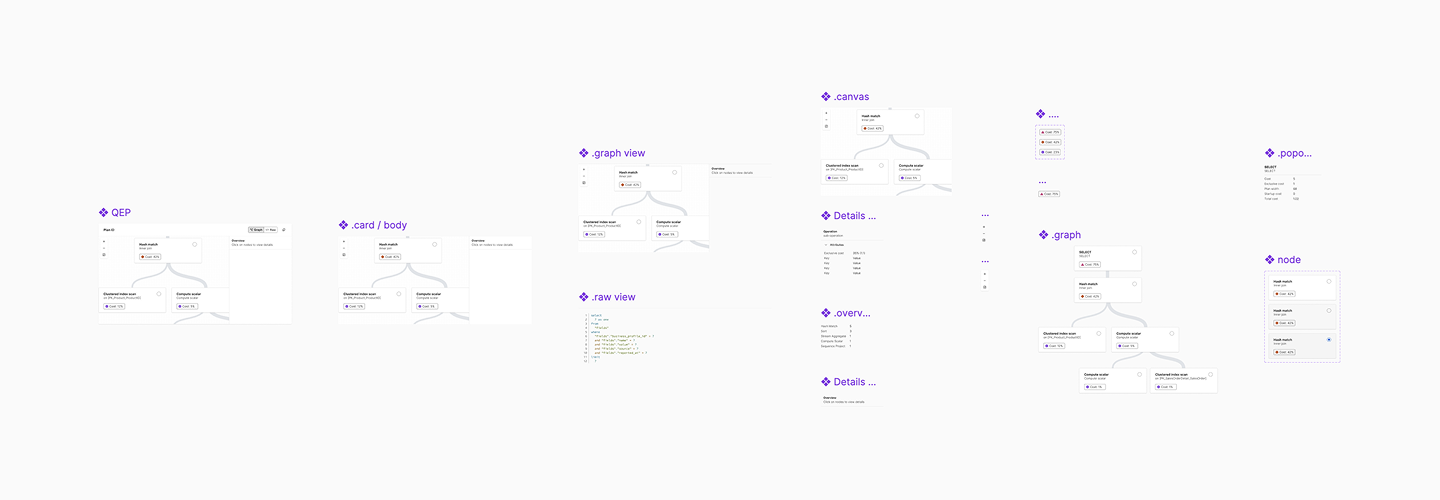
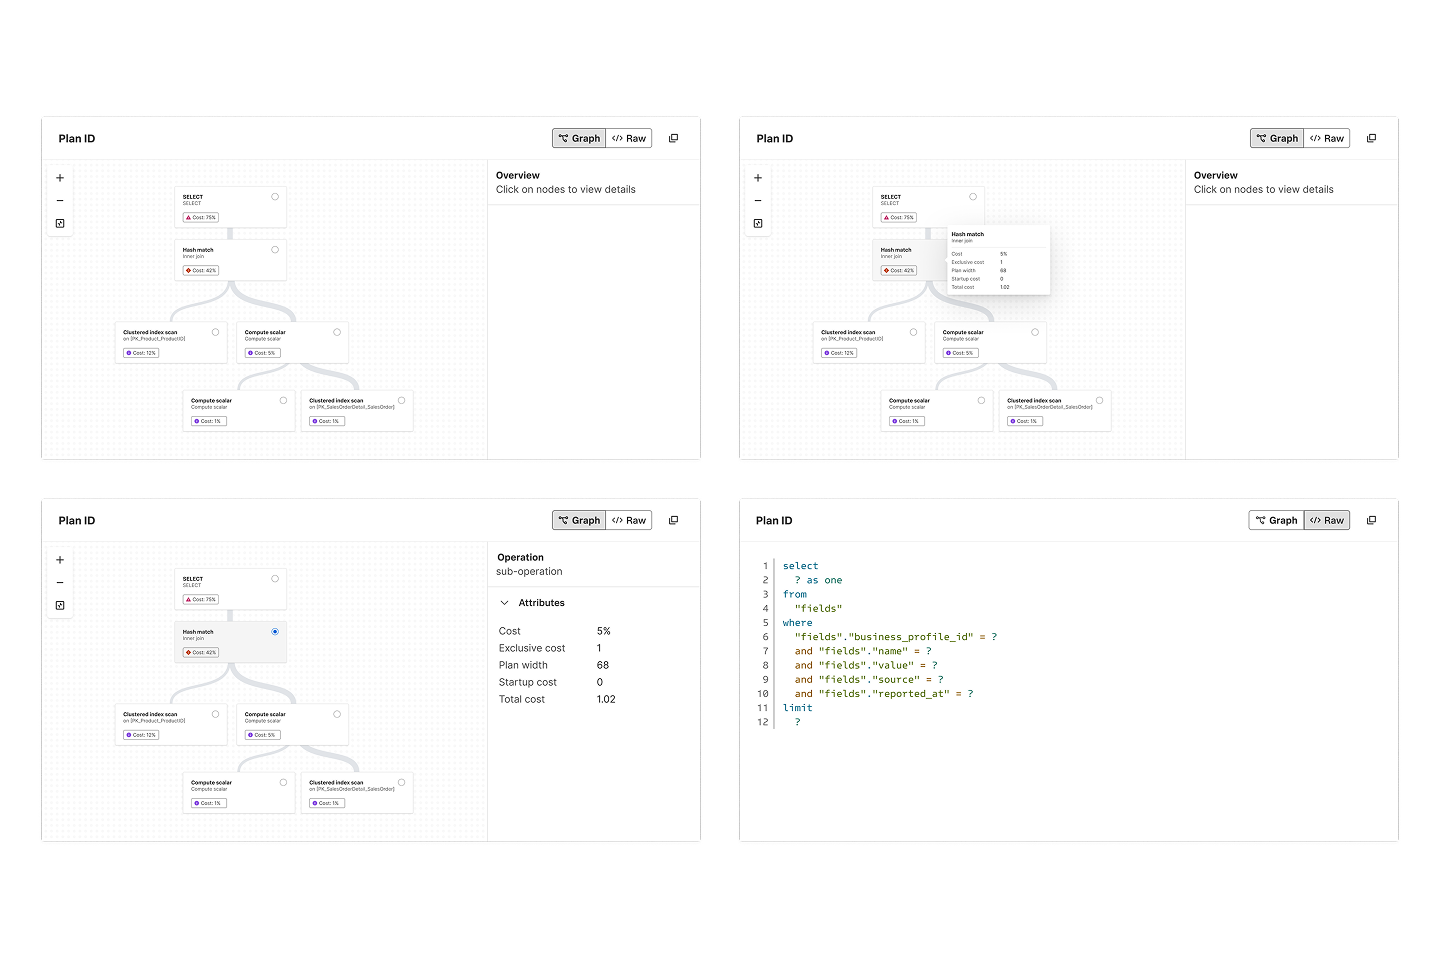
Visualizations and micro-interactions
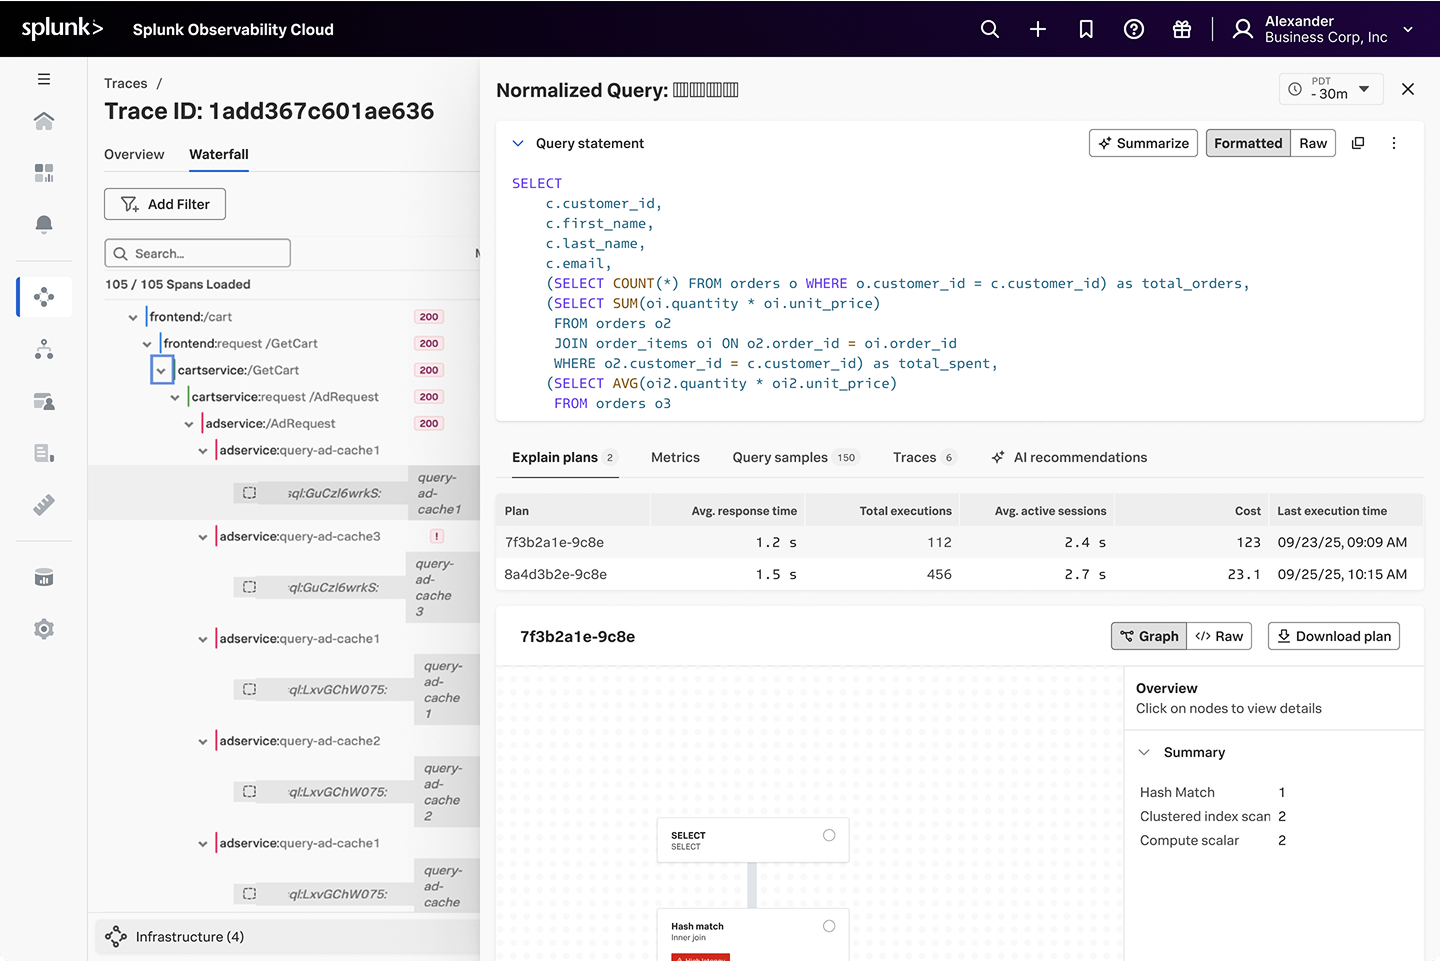
The query explain plan was visualized using a tree structure to represent the various operations involved in executing a database query. Micro-interactions were obsessed over to ensure that the tree structure was intuitive and easy to navigate.
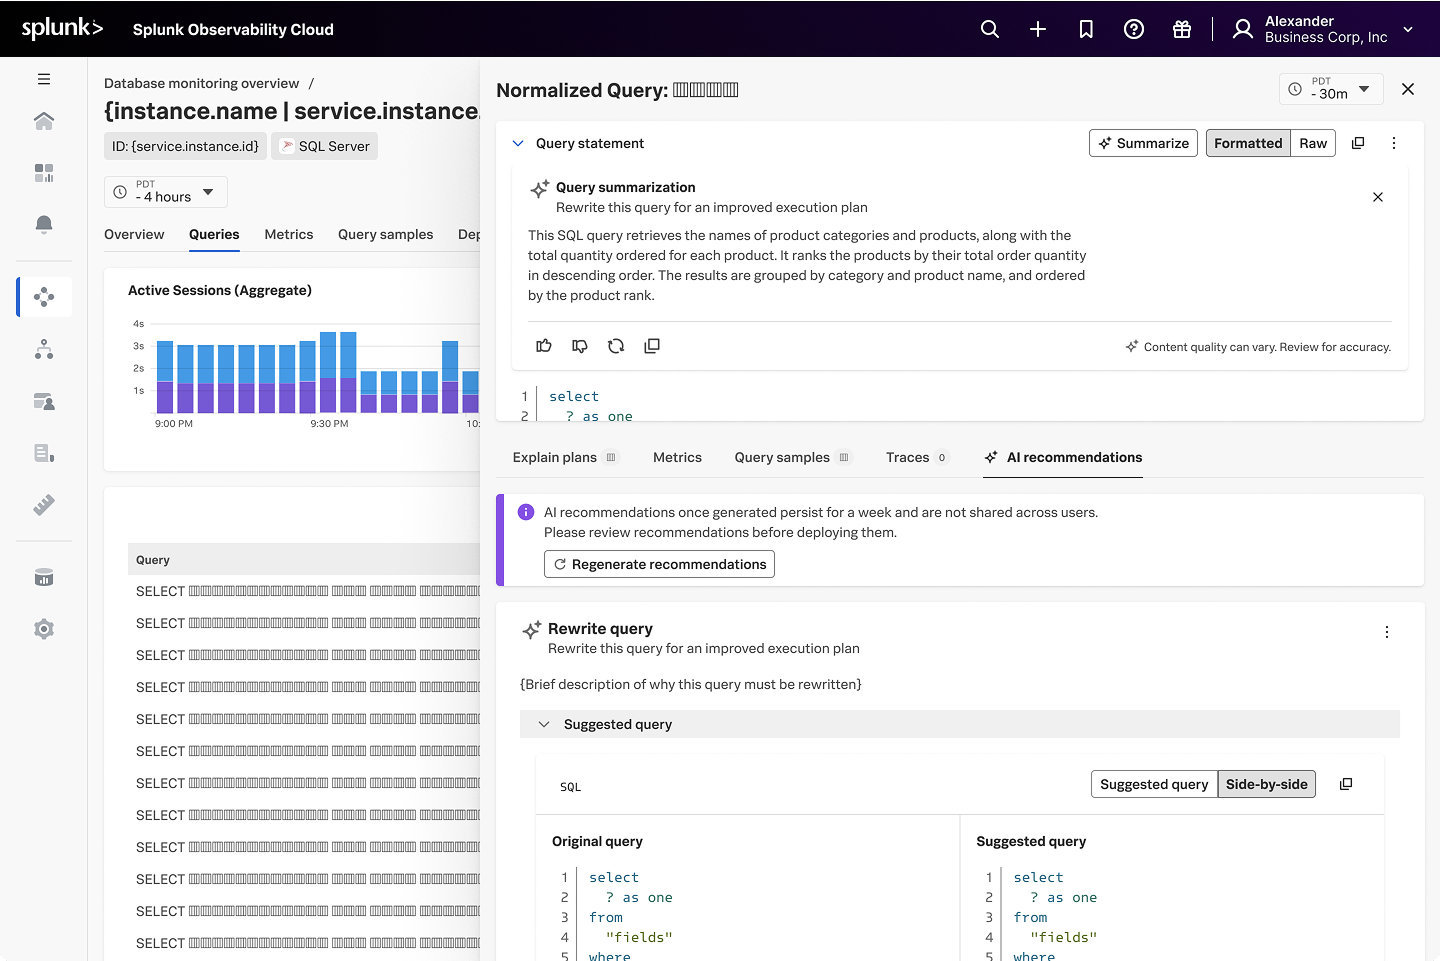
Defining AI-assisted workflows
I defined and designed AI-assisted workflows such as query summarization, and AI-based recommendations to help users optimize their database queries. Both these features are currently in customer preview and are getting positive feedback.
Artifacts