Database Monitoring on Splunk Observability Cloud
Table of contents
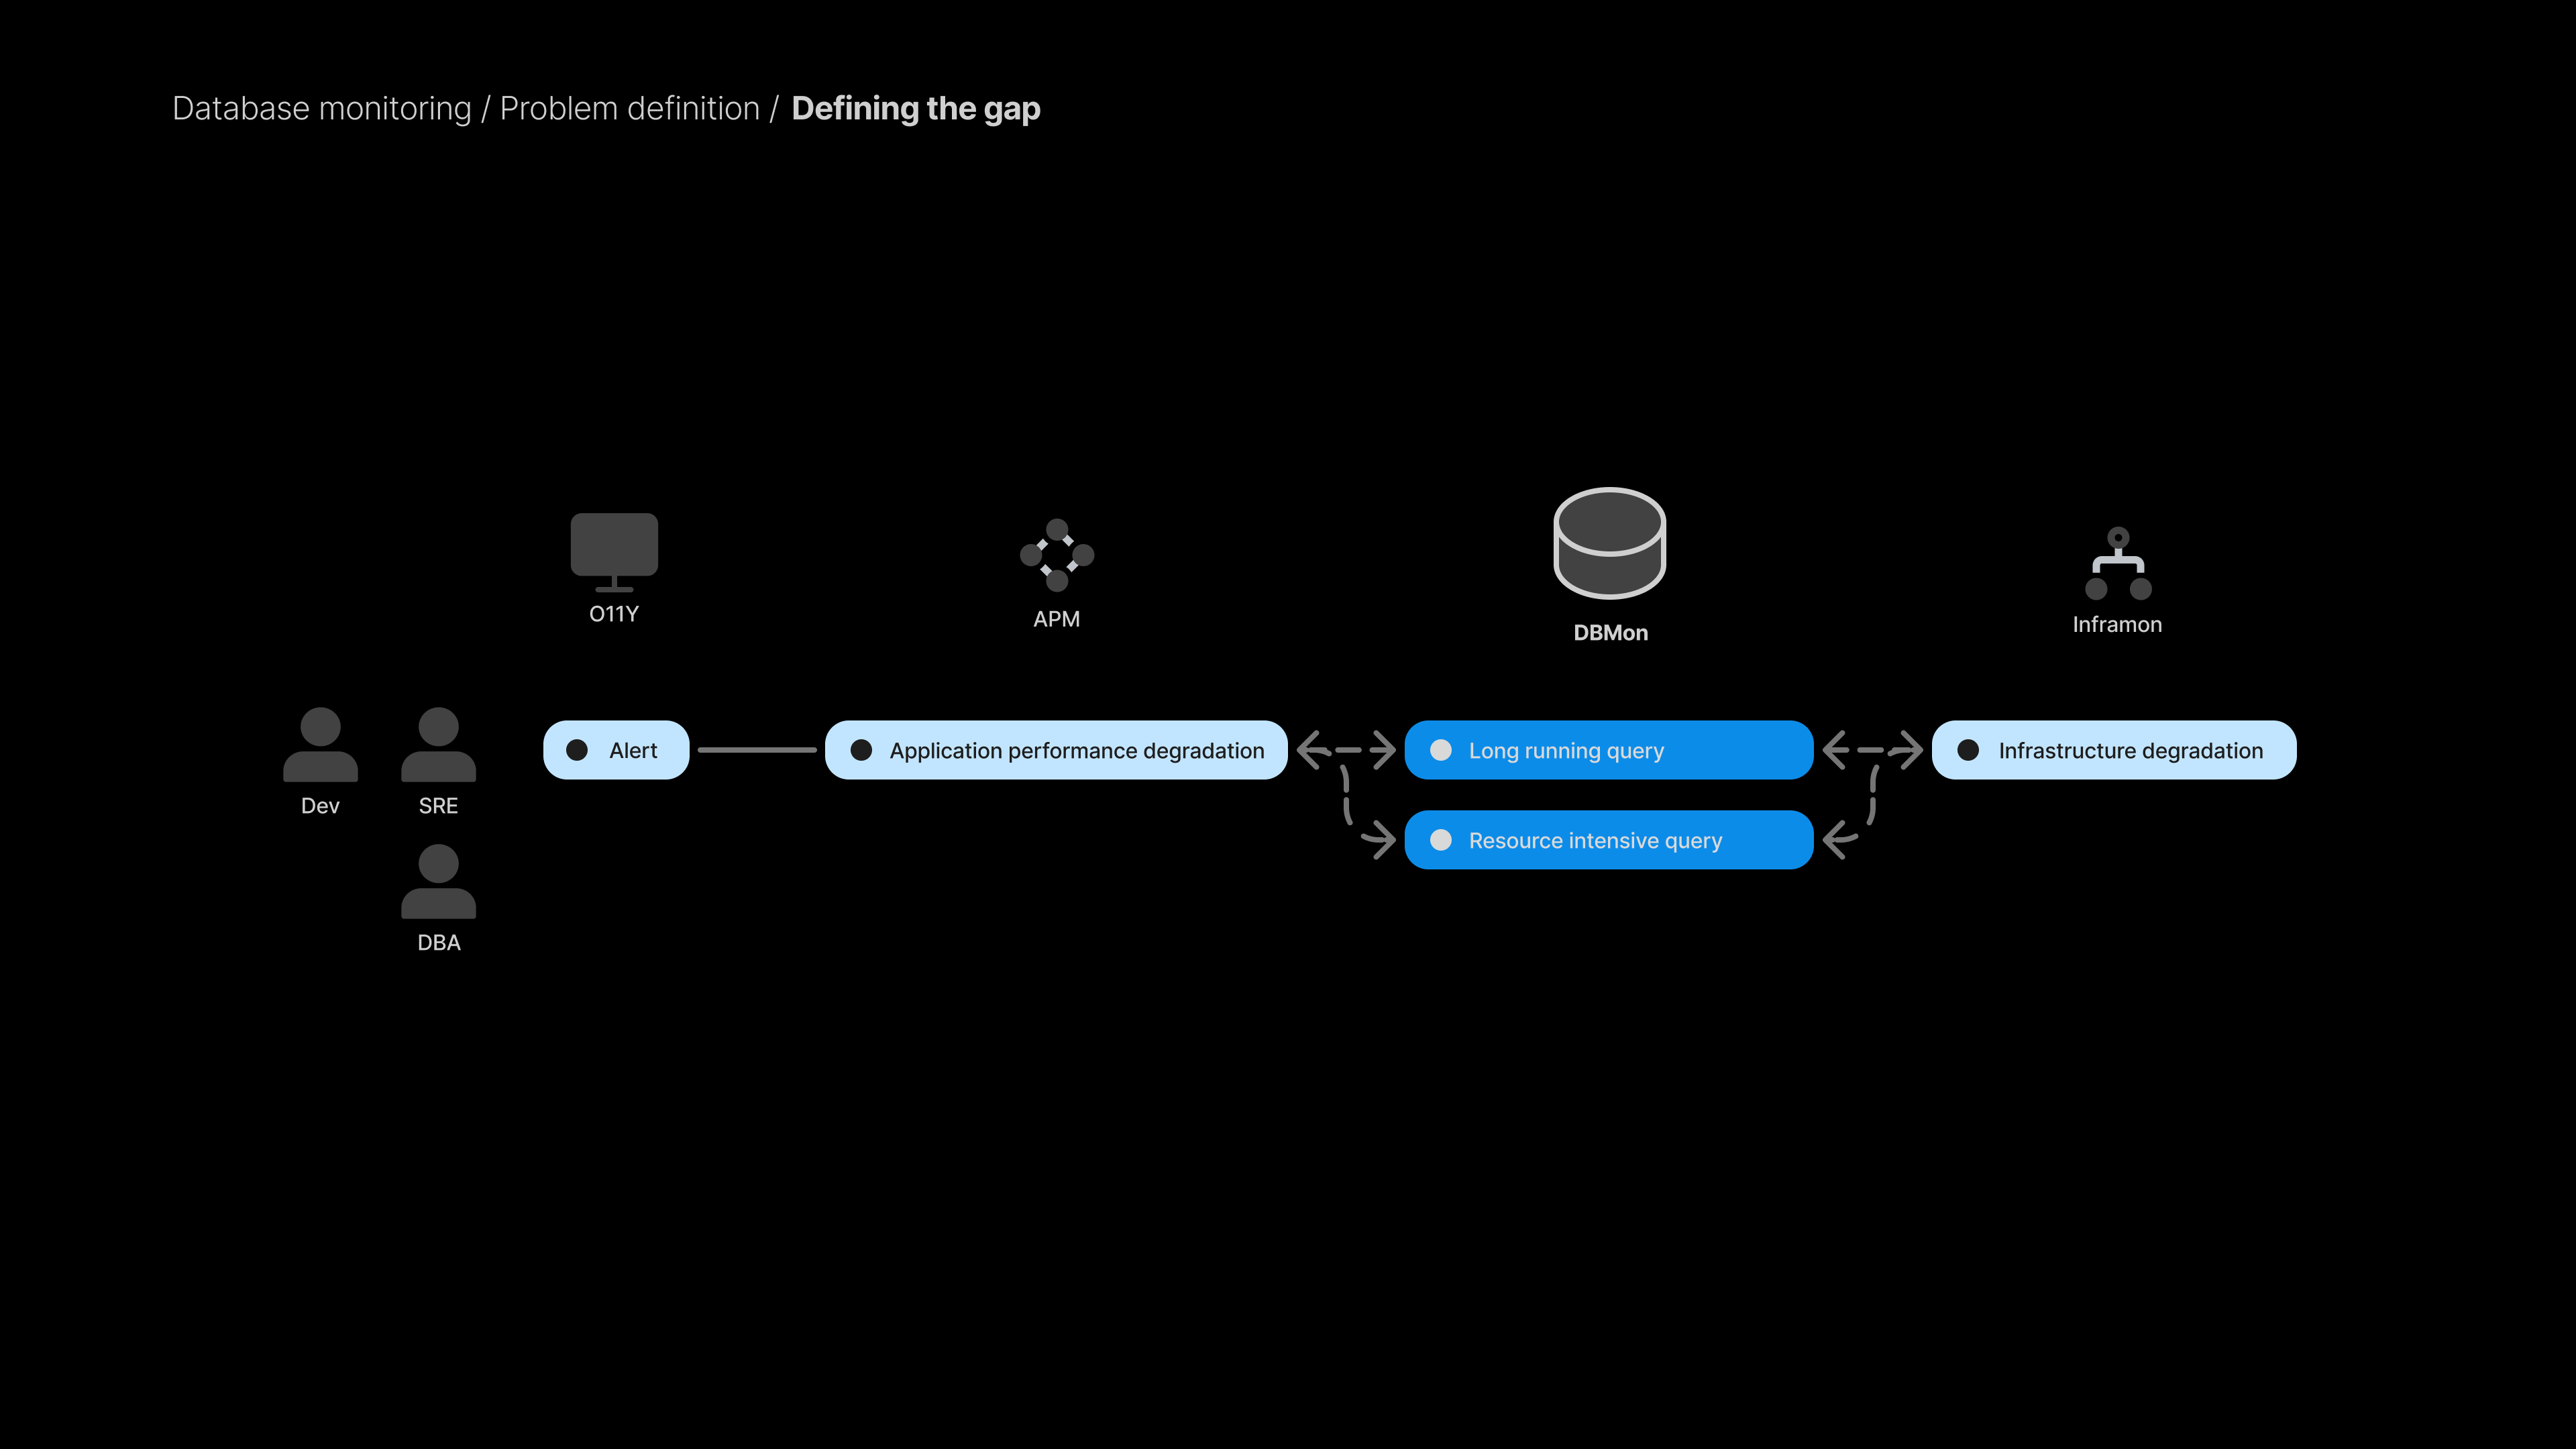
Problem definition: Defining the gap
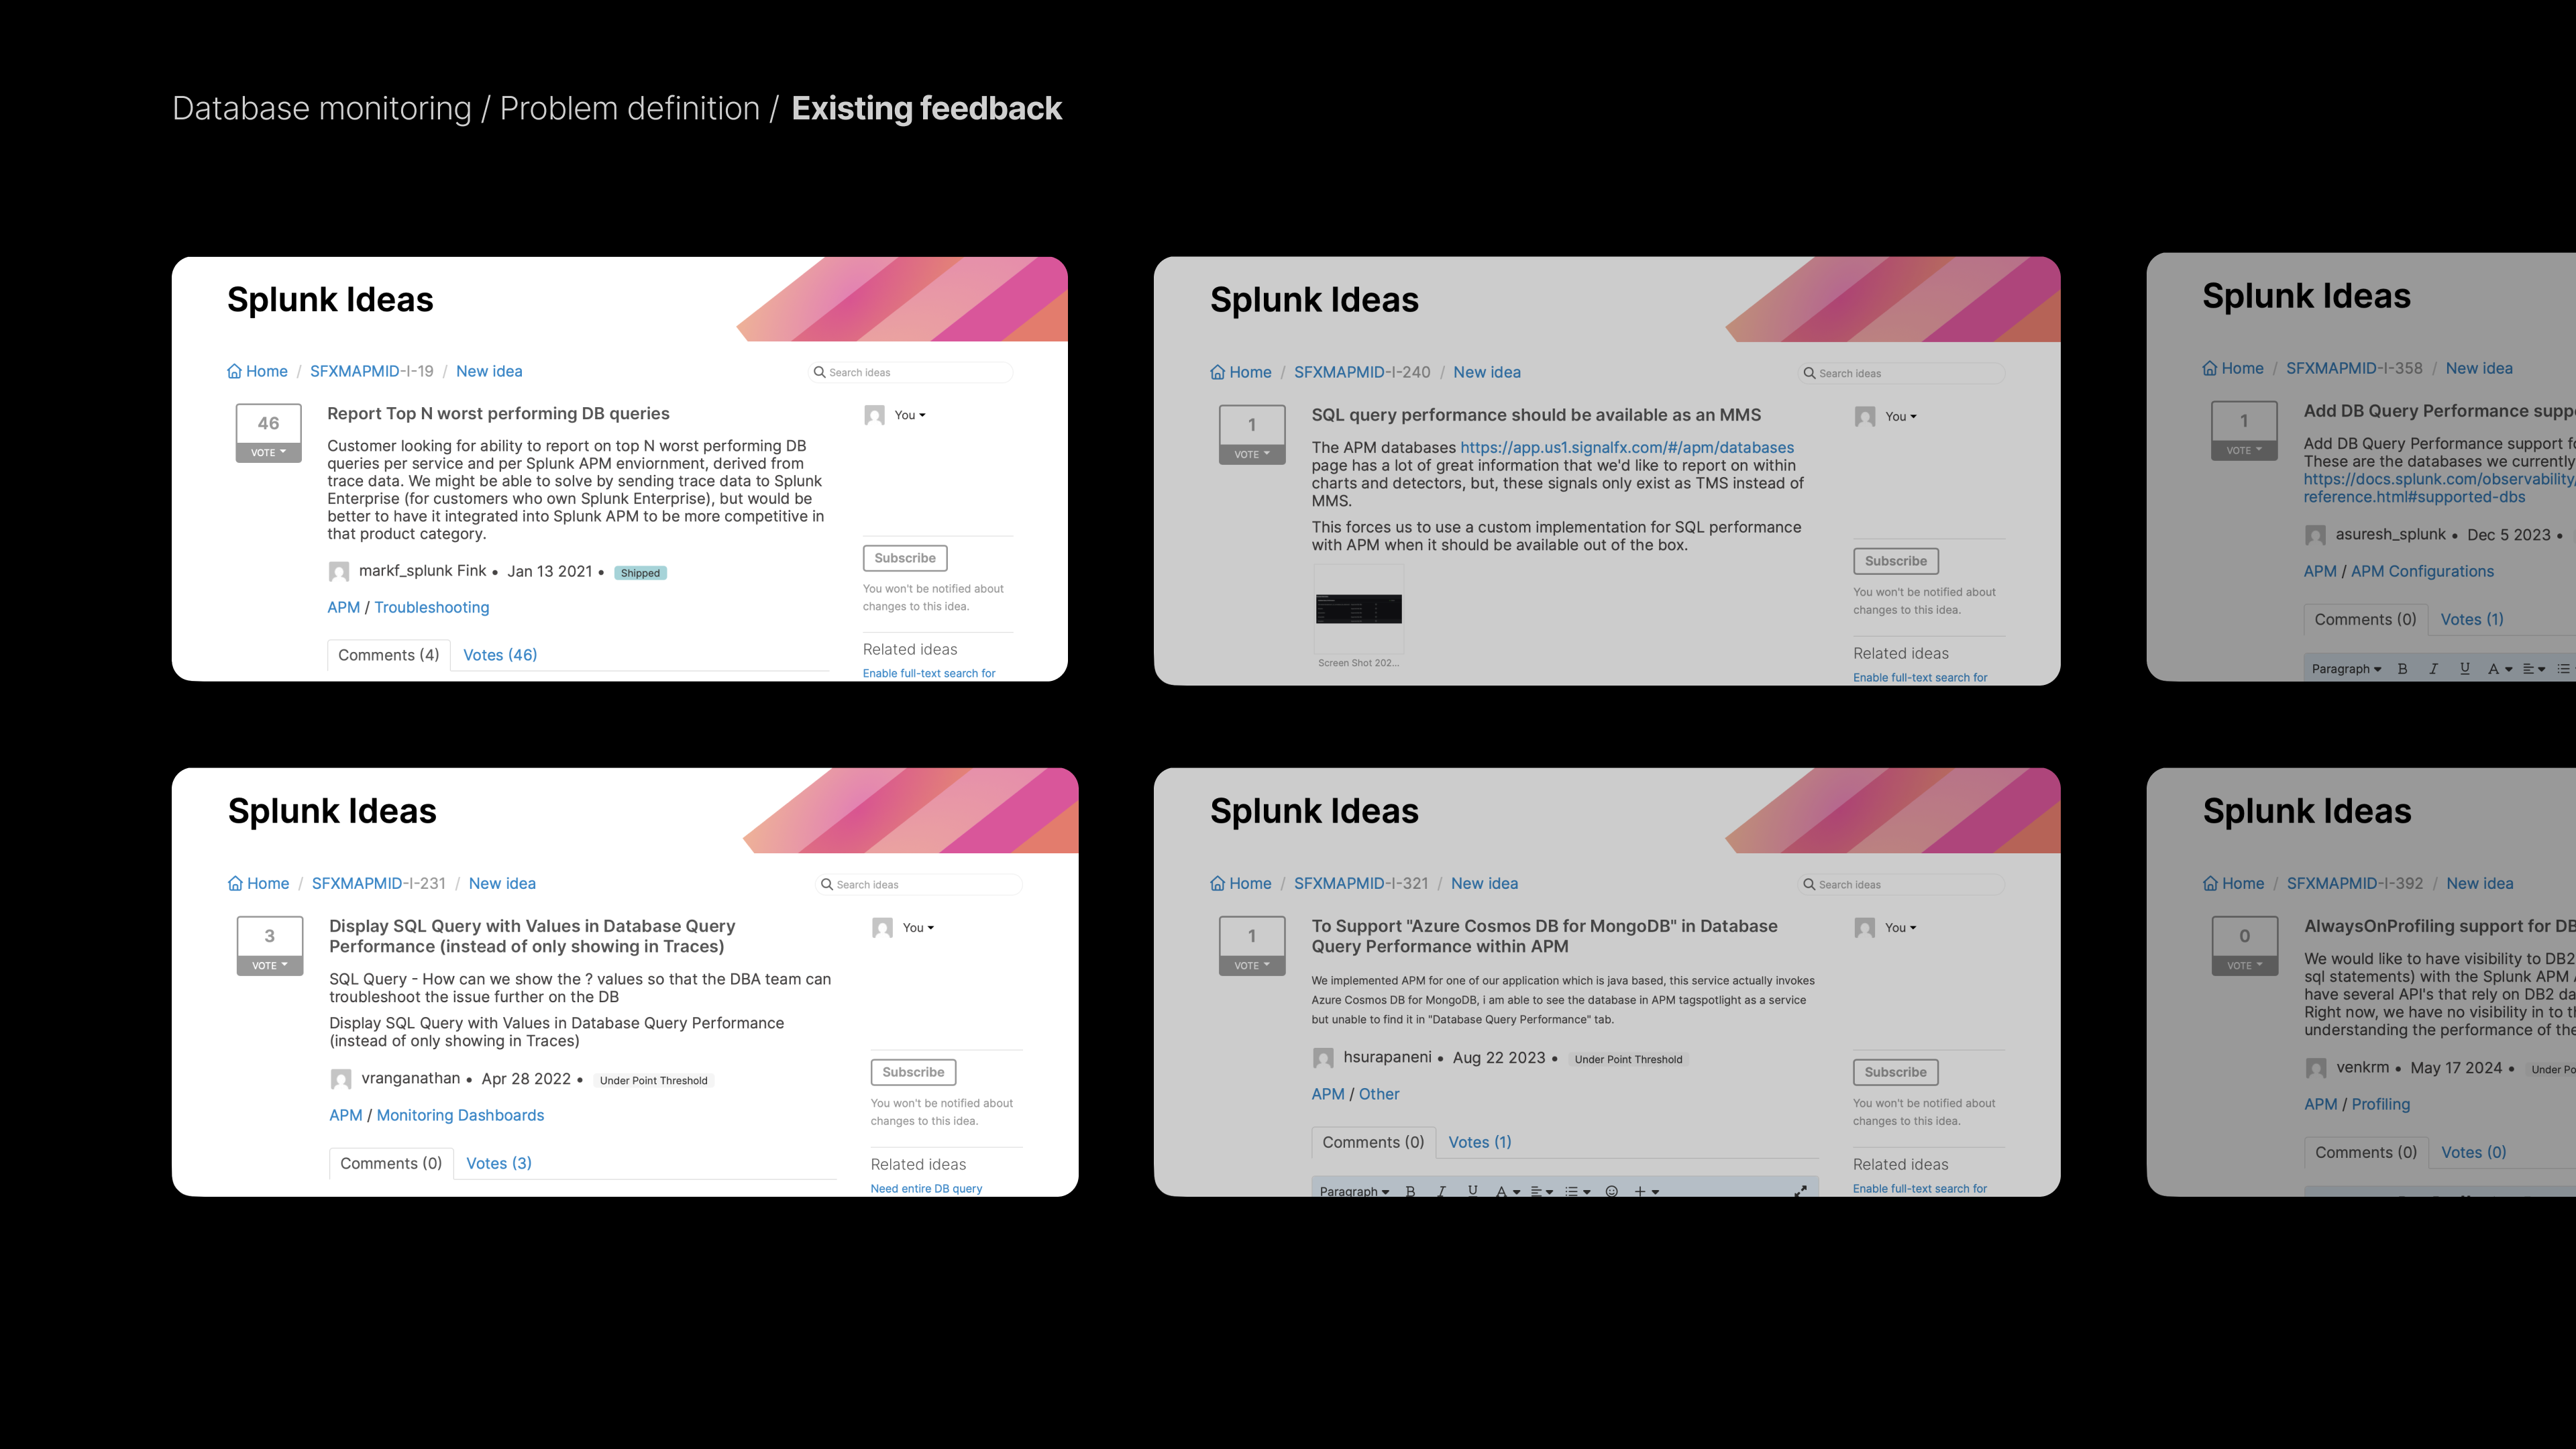
Splunk Observability Cloud excelled at application and infrastructure monitoring but lacked the end-to-end insight that database monitoring would provide. That gap forced users to switch tools, even as public forum requests and AppDynamics’ $50M ARR success showed clear demand. Launching database monitoring would close the application-database performance divide and unlock new personas like database administrators, thereby expanding Splunk Observability Cloud’s total addressable market.

My role
As lead designer for the core team (1 product manager, 12 engineers), I drove the design vision for Database Monitoring. I collaborated cross-functionally with the APM team’s lead designer and product manager to integrate workflows between Database Monitoring and Application Performance Monitoring. Additionally, I partnered with the AI engineering team to design and prioritize intelligent features, including query summarization and AI-powered recommendations.
Impact
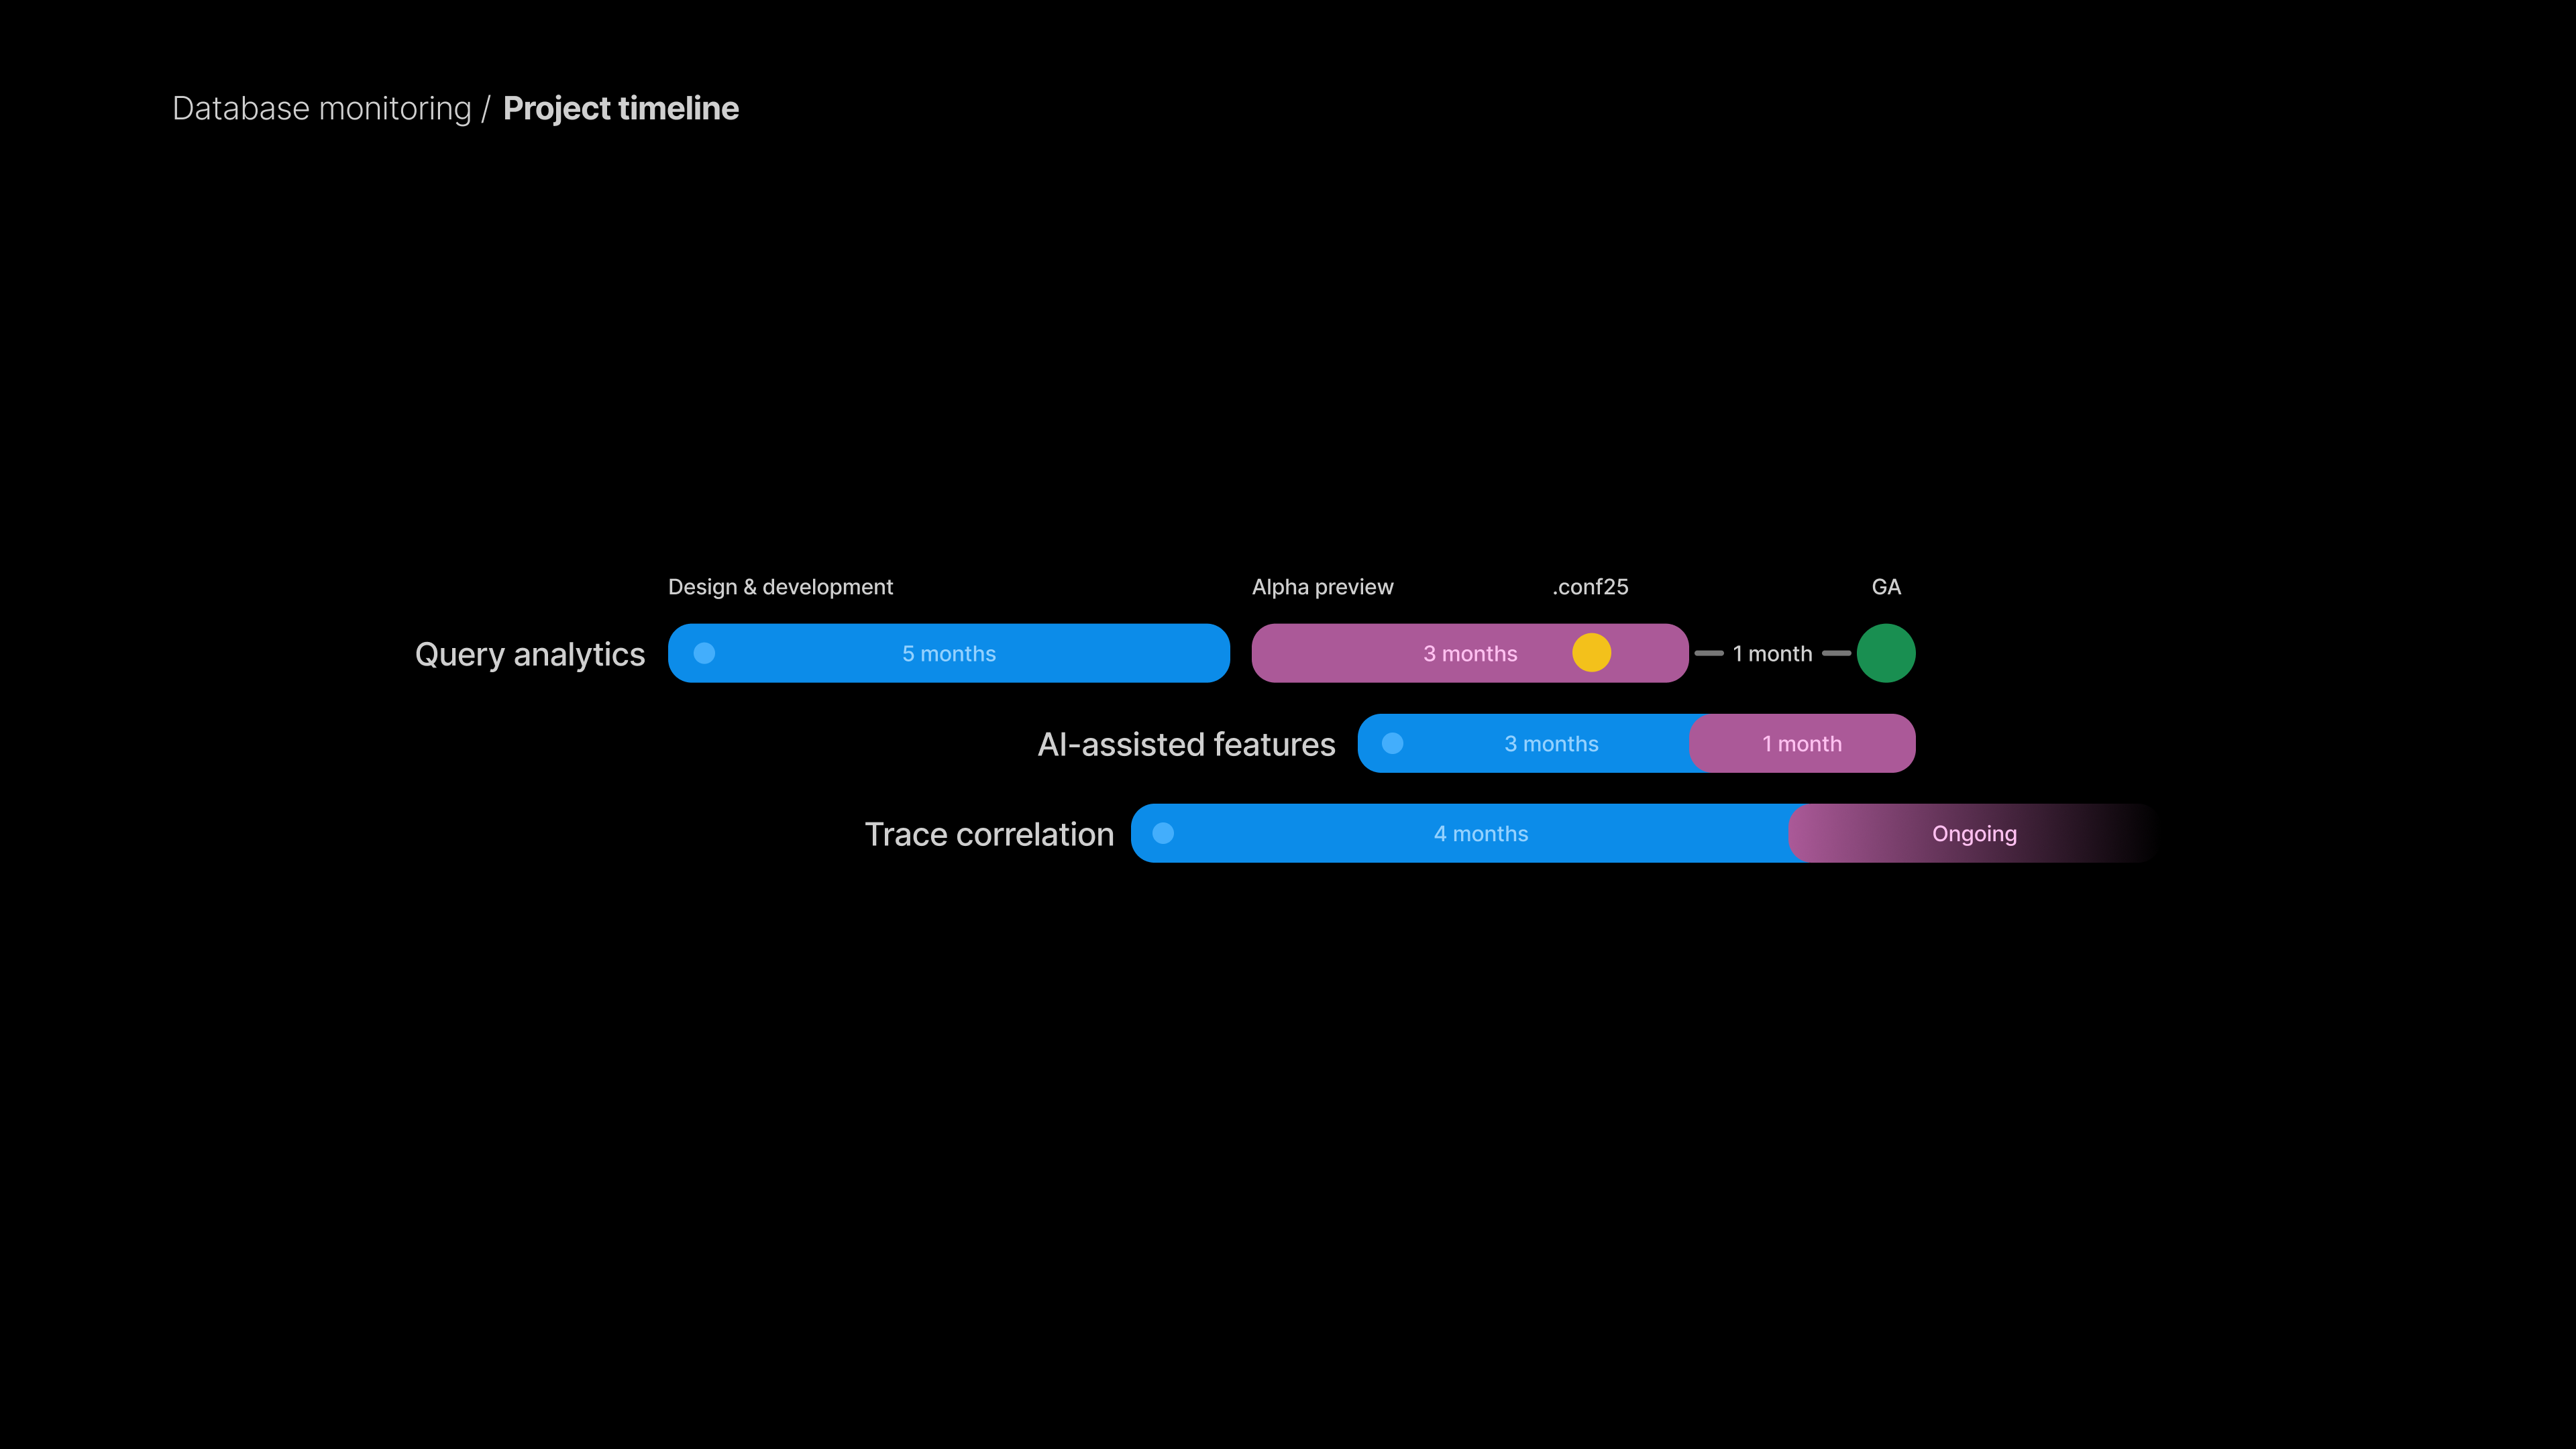
Alpha launch of Database monitoring had 11 multinational enterprise customers with a conversion rate upwards of 60% within 3 months of launch in November of 2025. The number of annual licenses is currently targeted at 25 by the end of Q1 2026.
“Our database team use SolarWinds. dbmon [sic database monitoring] gives me query plan information that I’ll only know once the application developer knows the issue is with the database… and when the database team will be looped in eventually to the ticket.”
Designing an MVP
The first launch targeted query analytics, enabling workflows joining APM and Database monitoring, as well as providing AI-assisted summarization, and recommendation capabilities. The MVP focused on three core user needs:
- Surface vital metrics and visualize query explain plans for database queries,
- Correlate database queries with application traces, and
- Launch database monitoring with AI-assisted workflows.
Along the way, I ended up:
- Defining a new design pattern (In-context previews), and
- Experimenting with in-product marketing to encourage product-led adoption
Key design decisions
Following are notable design decisions I made as part of the database monitoring initiative.
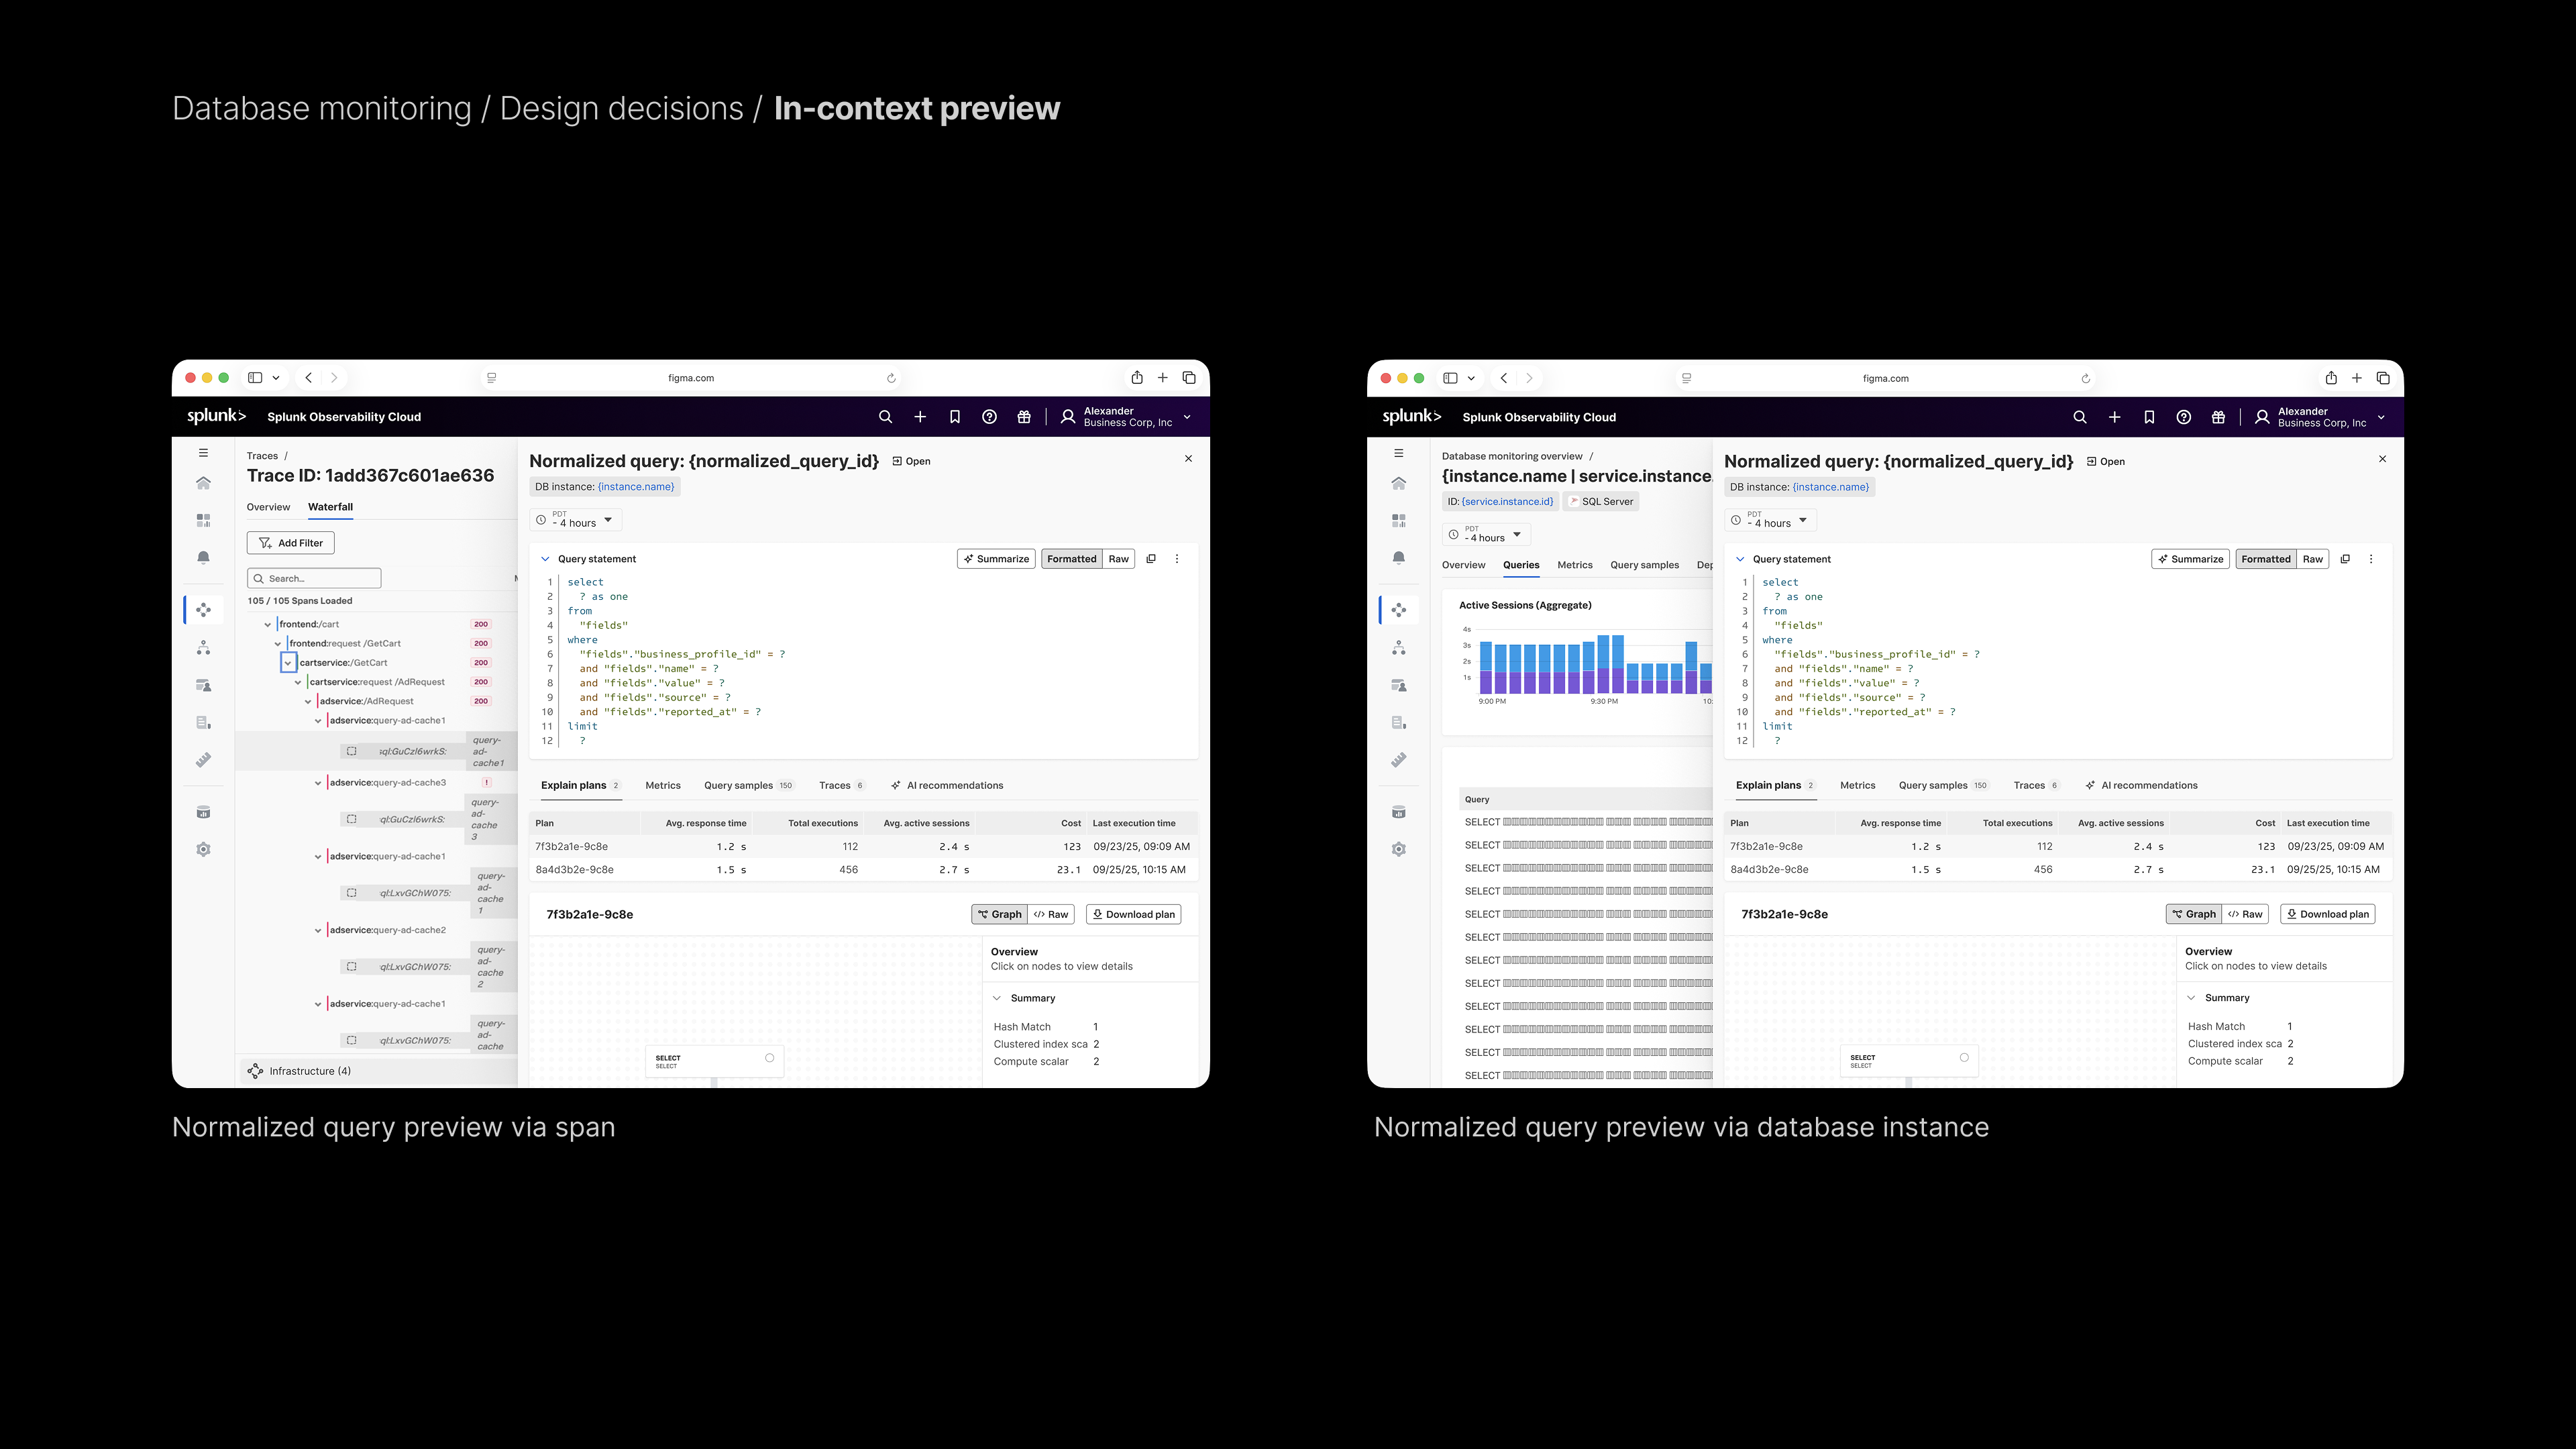
In-context preview
The in-context preview utilizes the concept of transclusion to provide a non-disruptive way to access detailed information without navigating away from the current context. This was especially important when users were investigating application traces and needed to quickly understand the associated database queries.
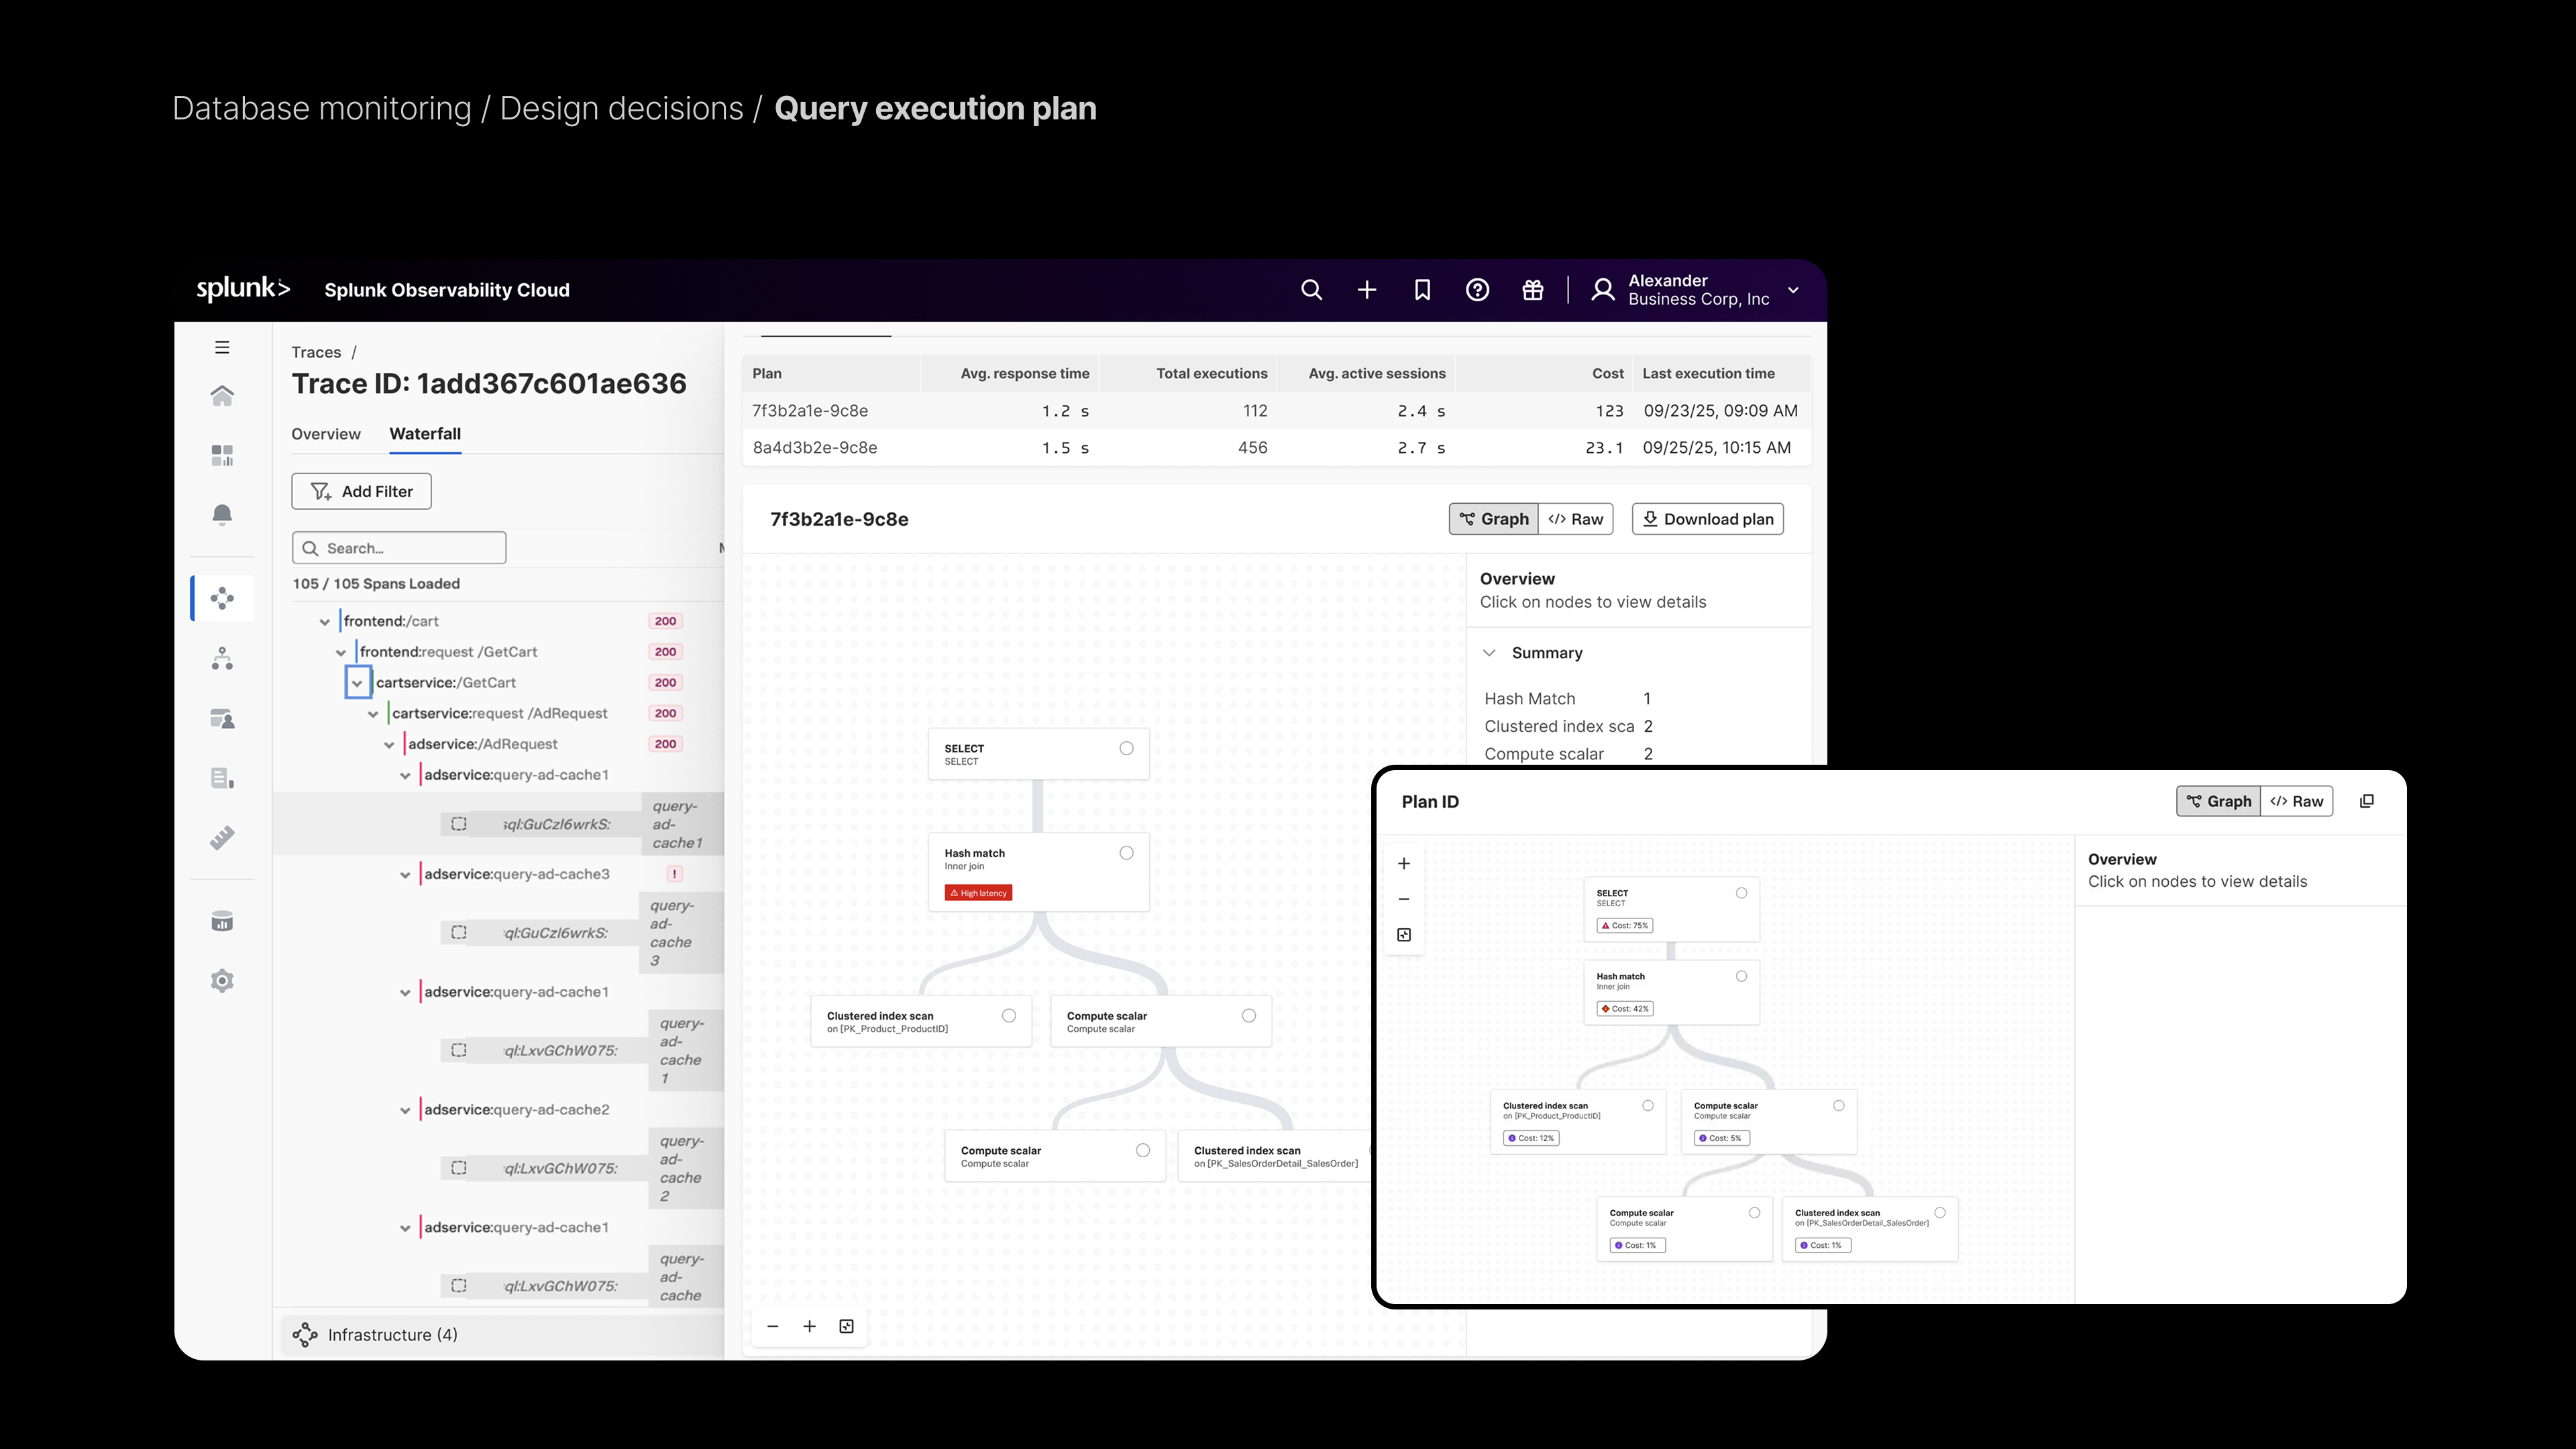
The query execution plan visualization
The query execution plan was visualized using a tree structure to represent the various operations involved in executing a database query. Micro-interactions were obsessed over to ensure that the tree structure was intuitive and easy to navigate. This is now part of the Splunk UI’s design system.
AI-assisted workflows
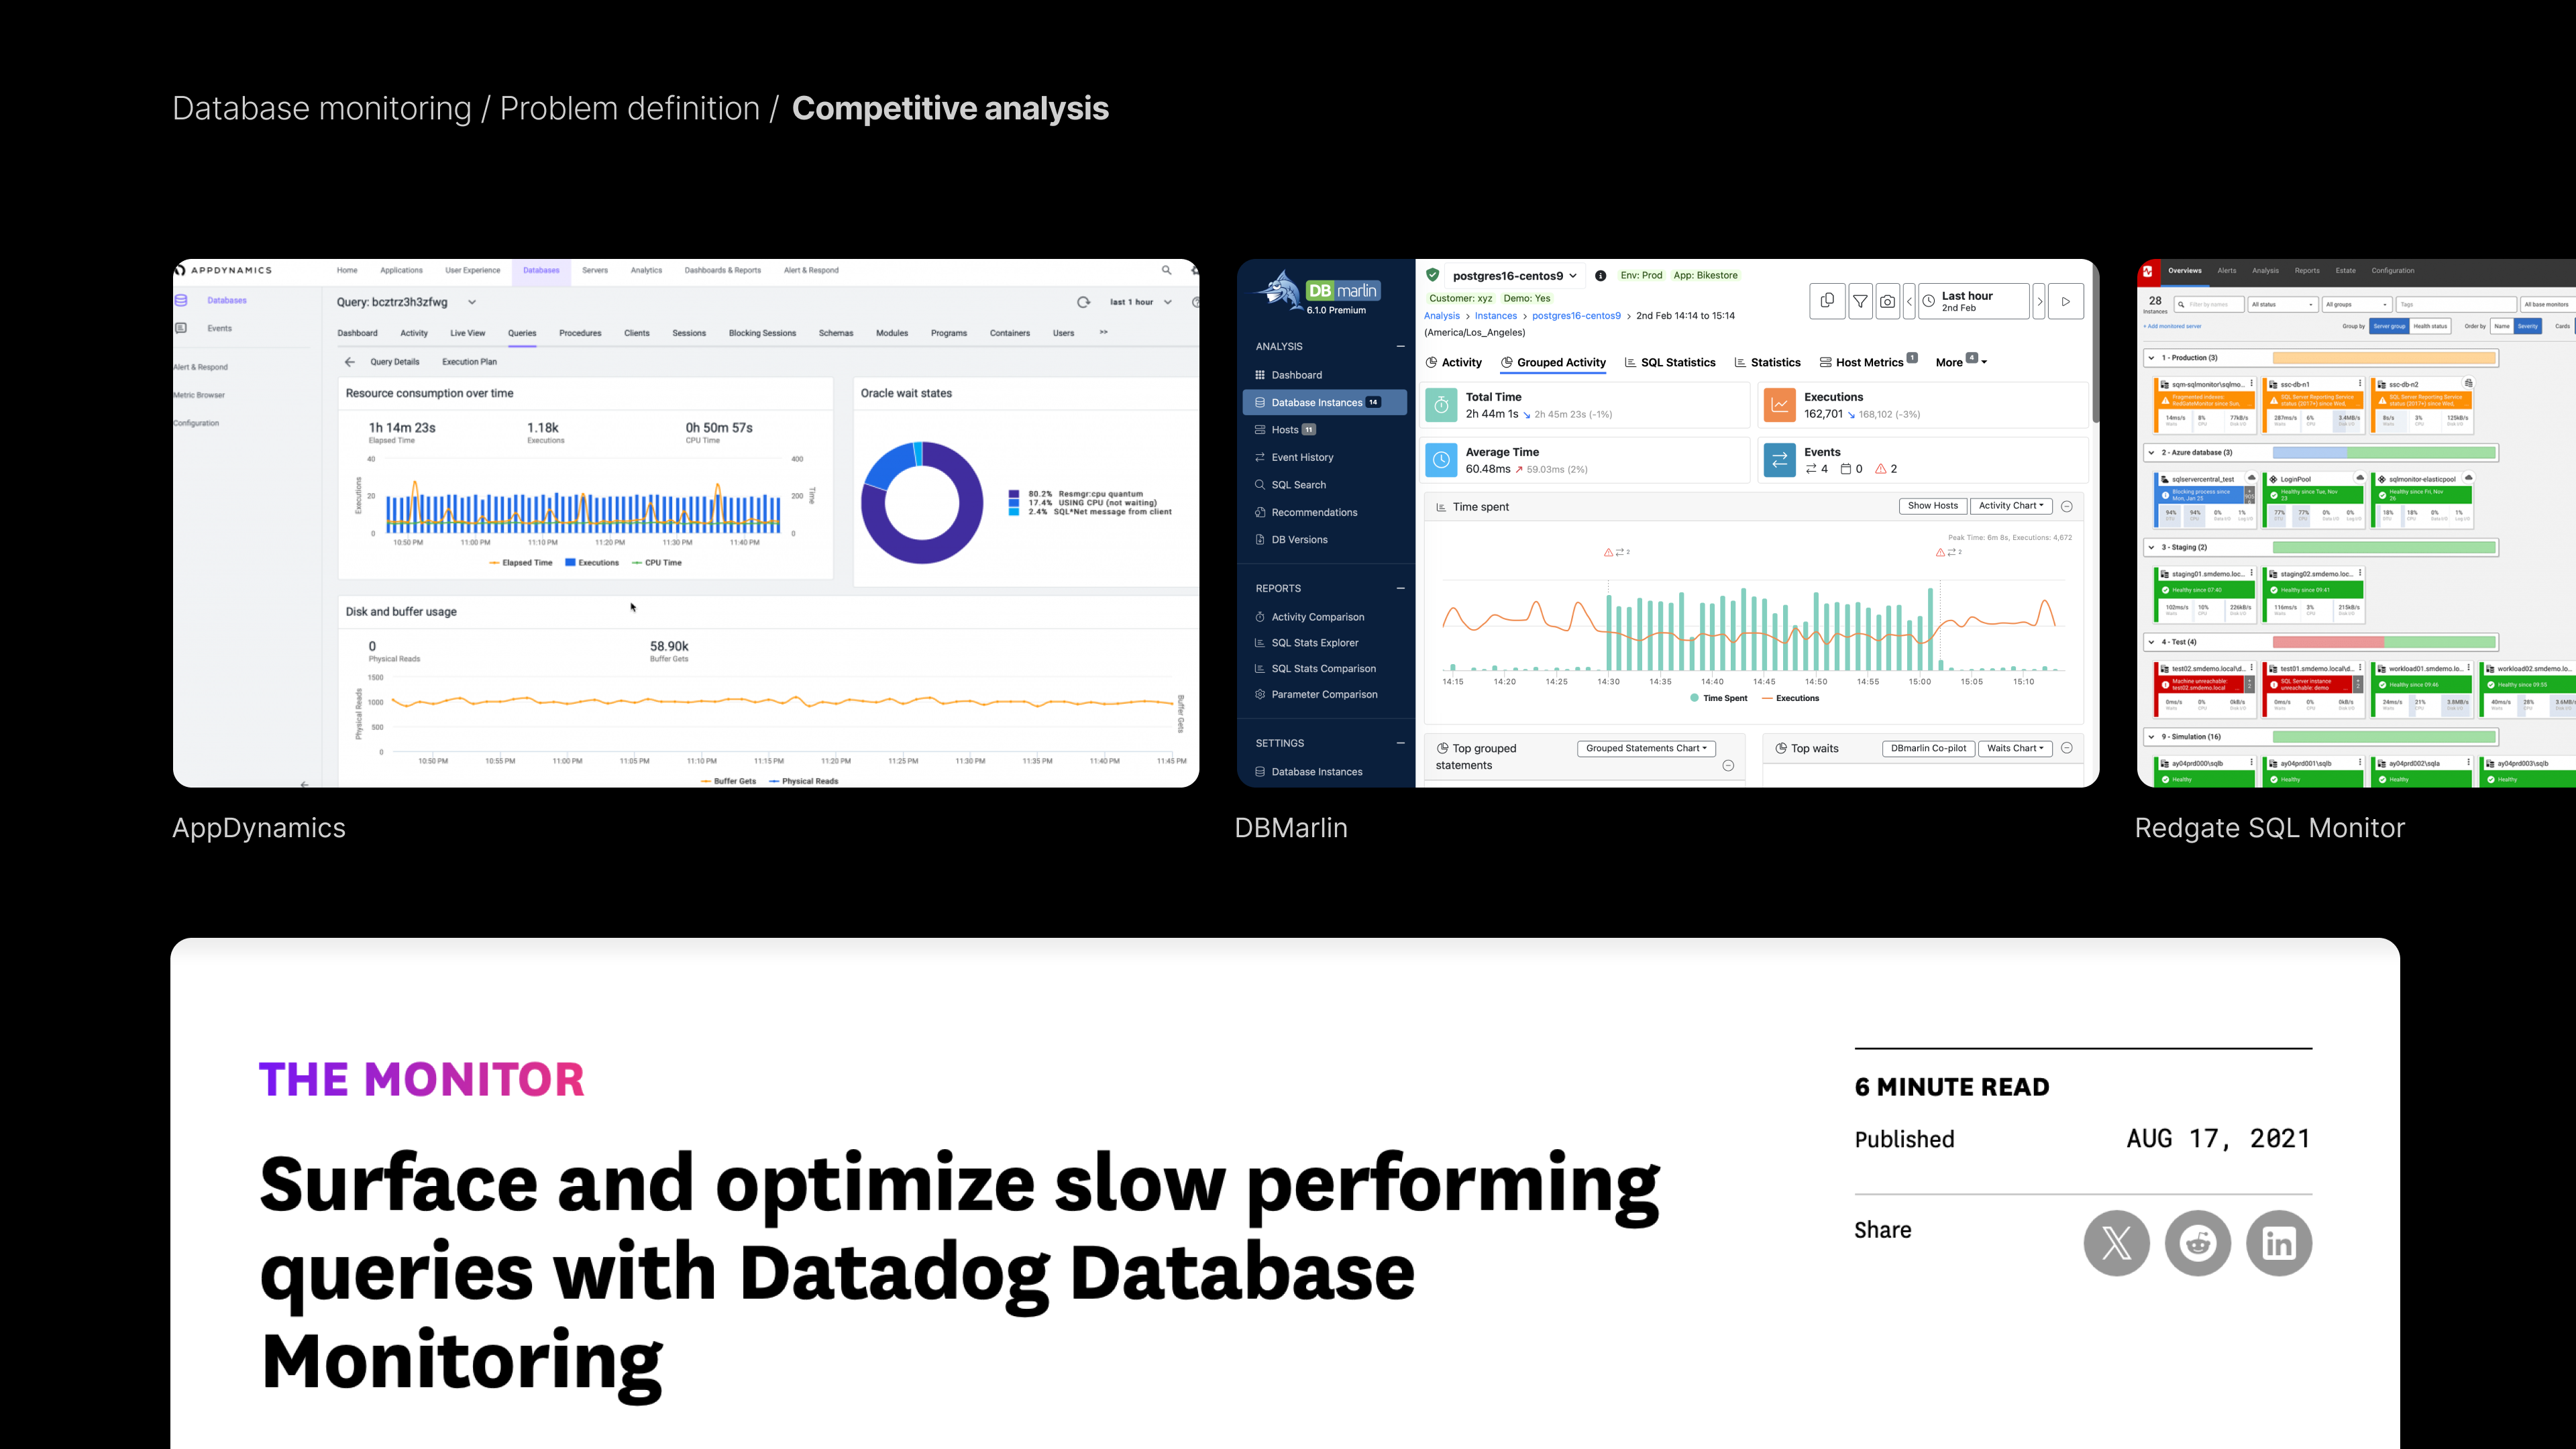
I defined and designed AI-assisted workflows such as query summarization, and AI-based recommendations to help users optimize their database queries. These features were prioritized based on competitive analysis, and engineering complexity. These are currently in customer preview and are getting positive feedback.
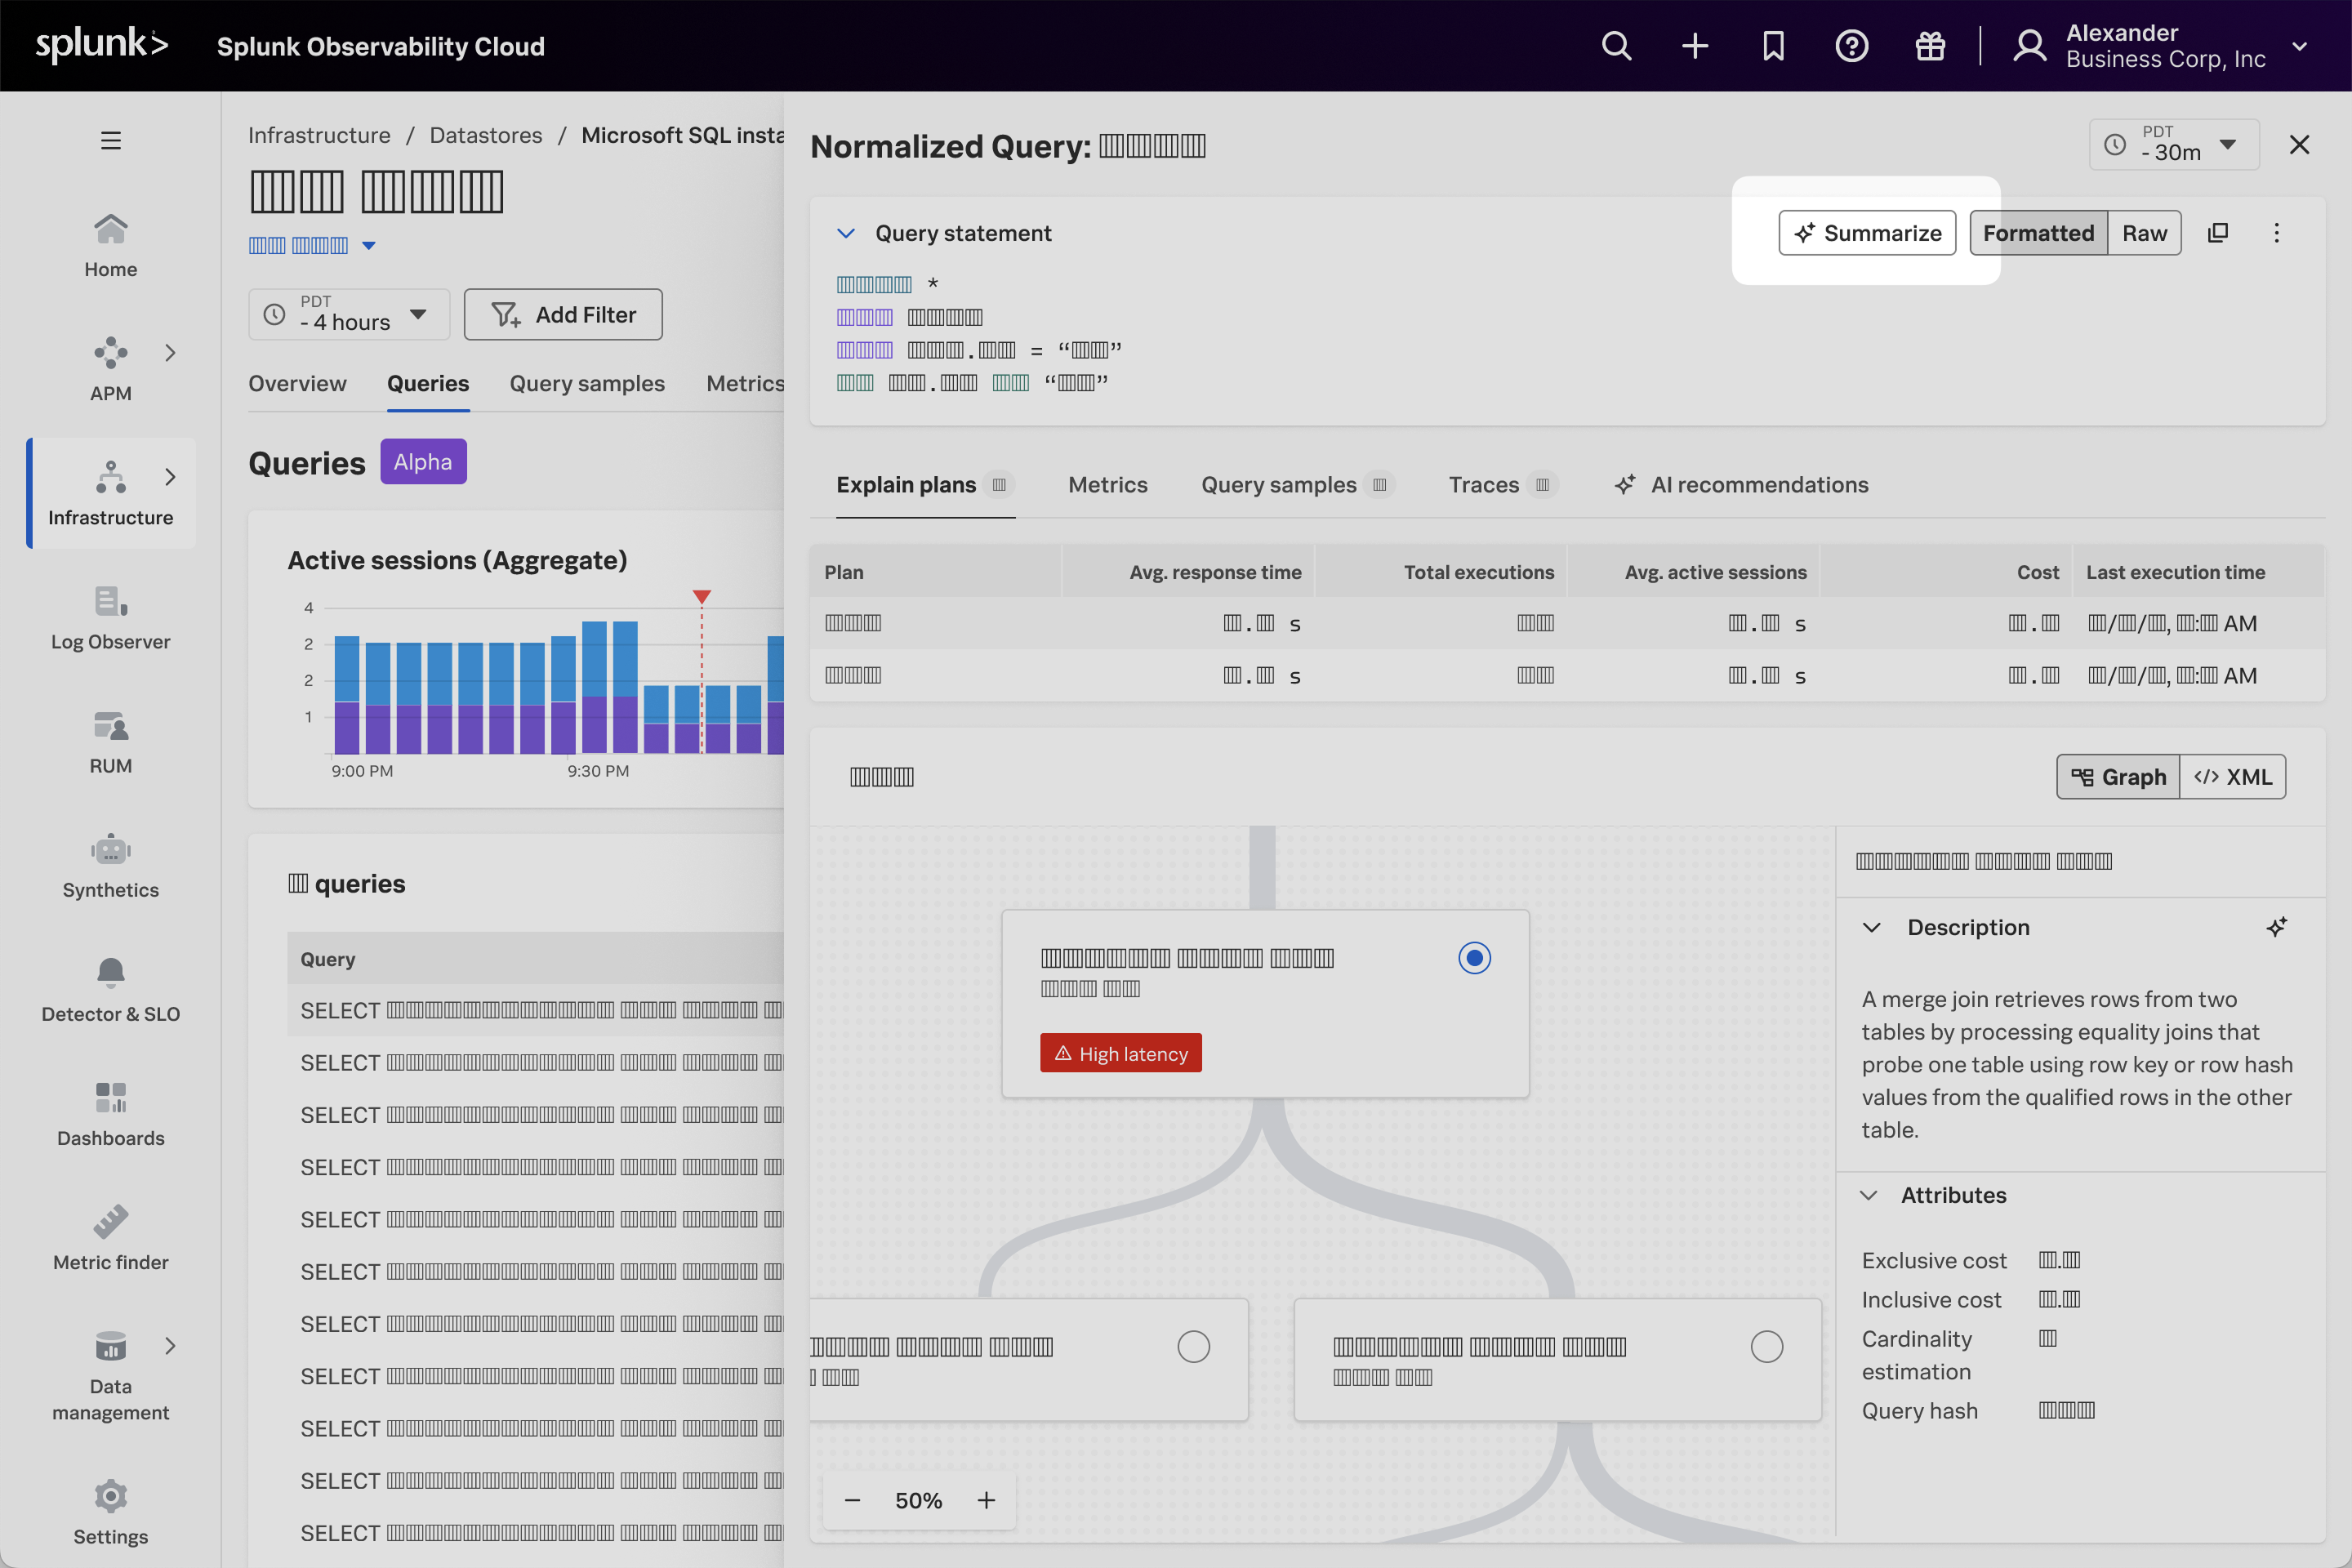
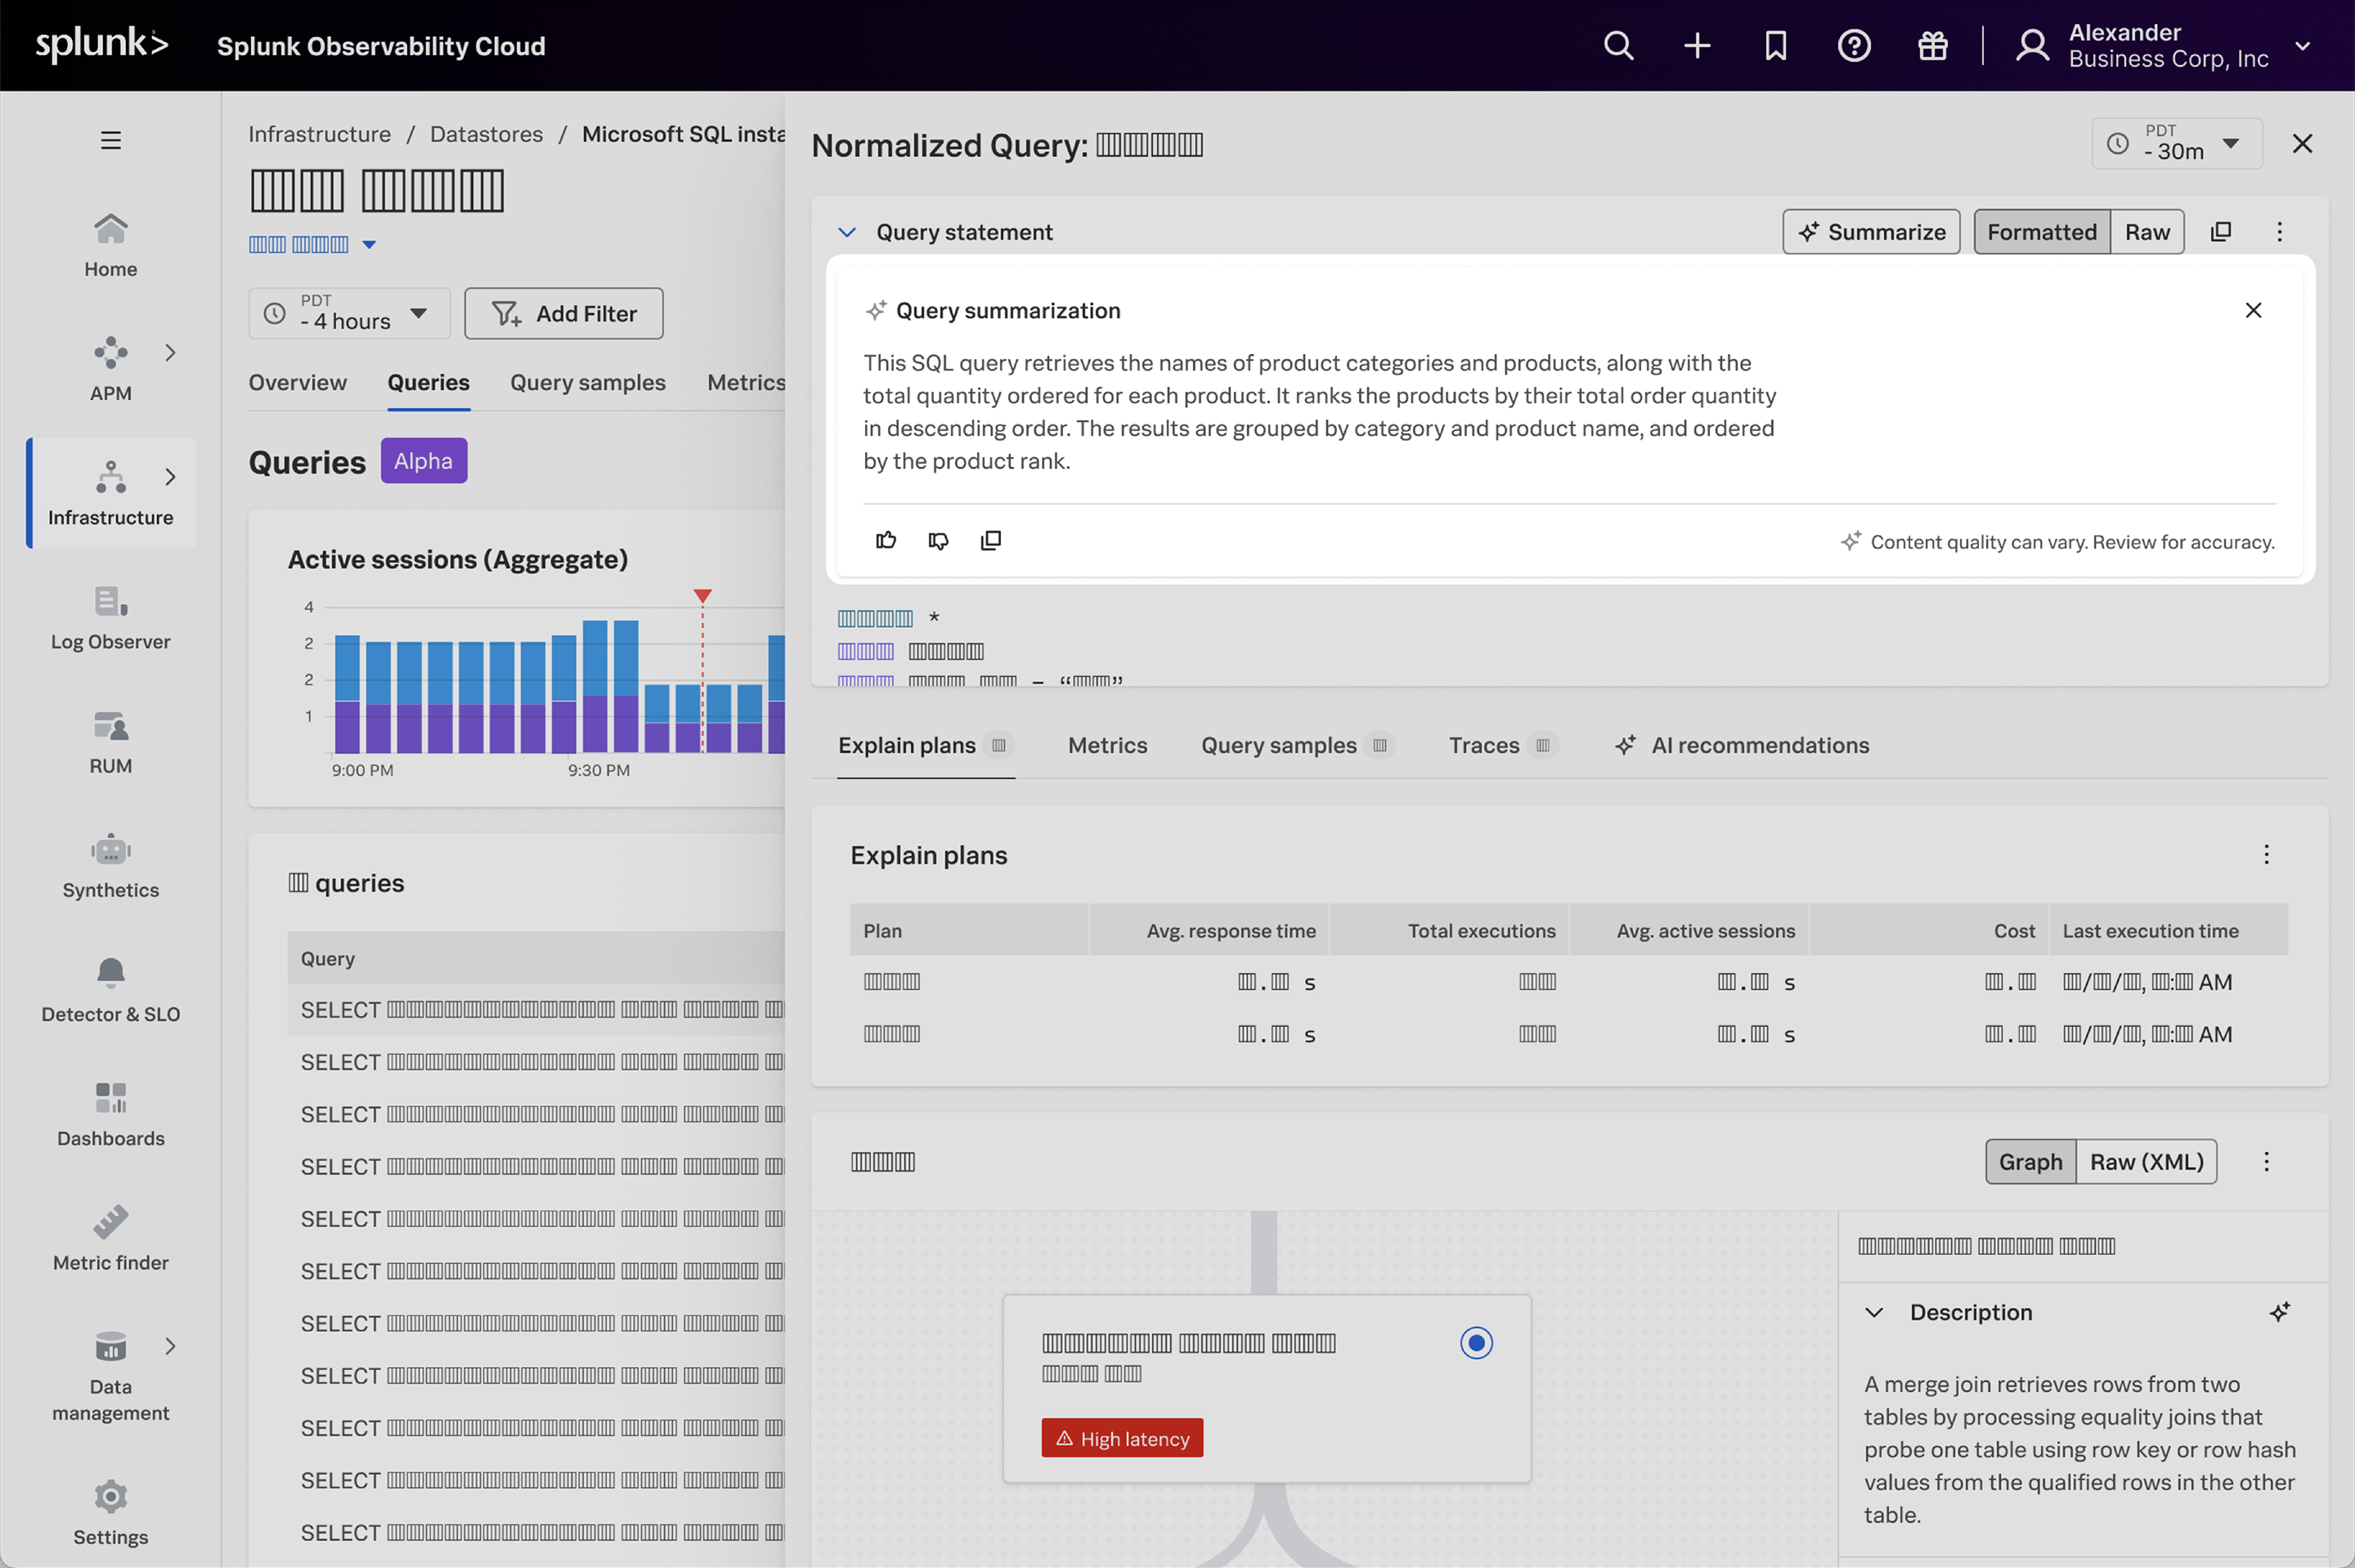
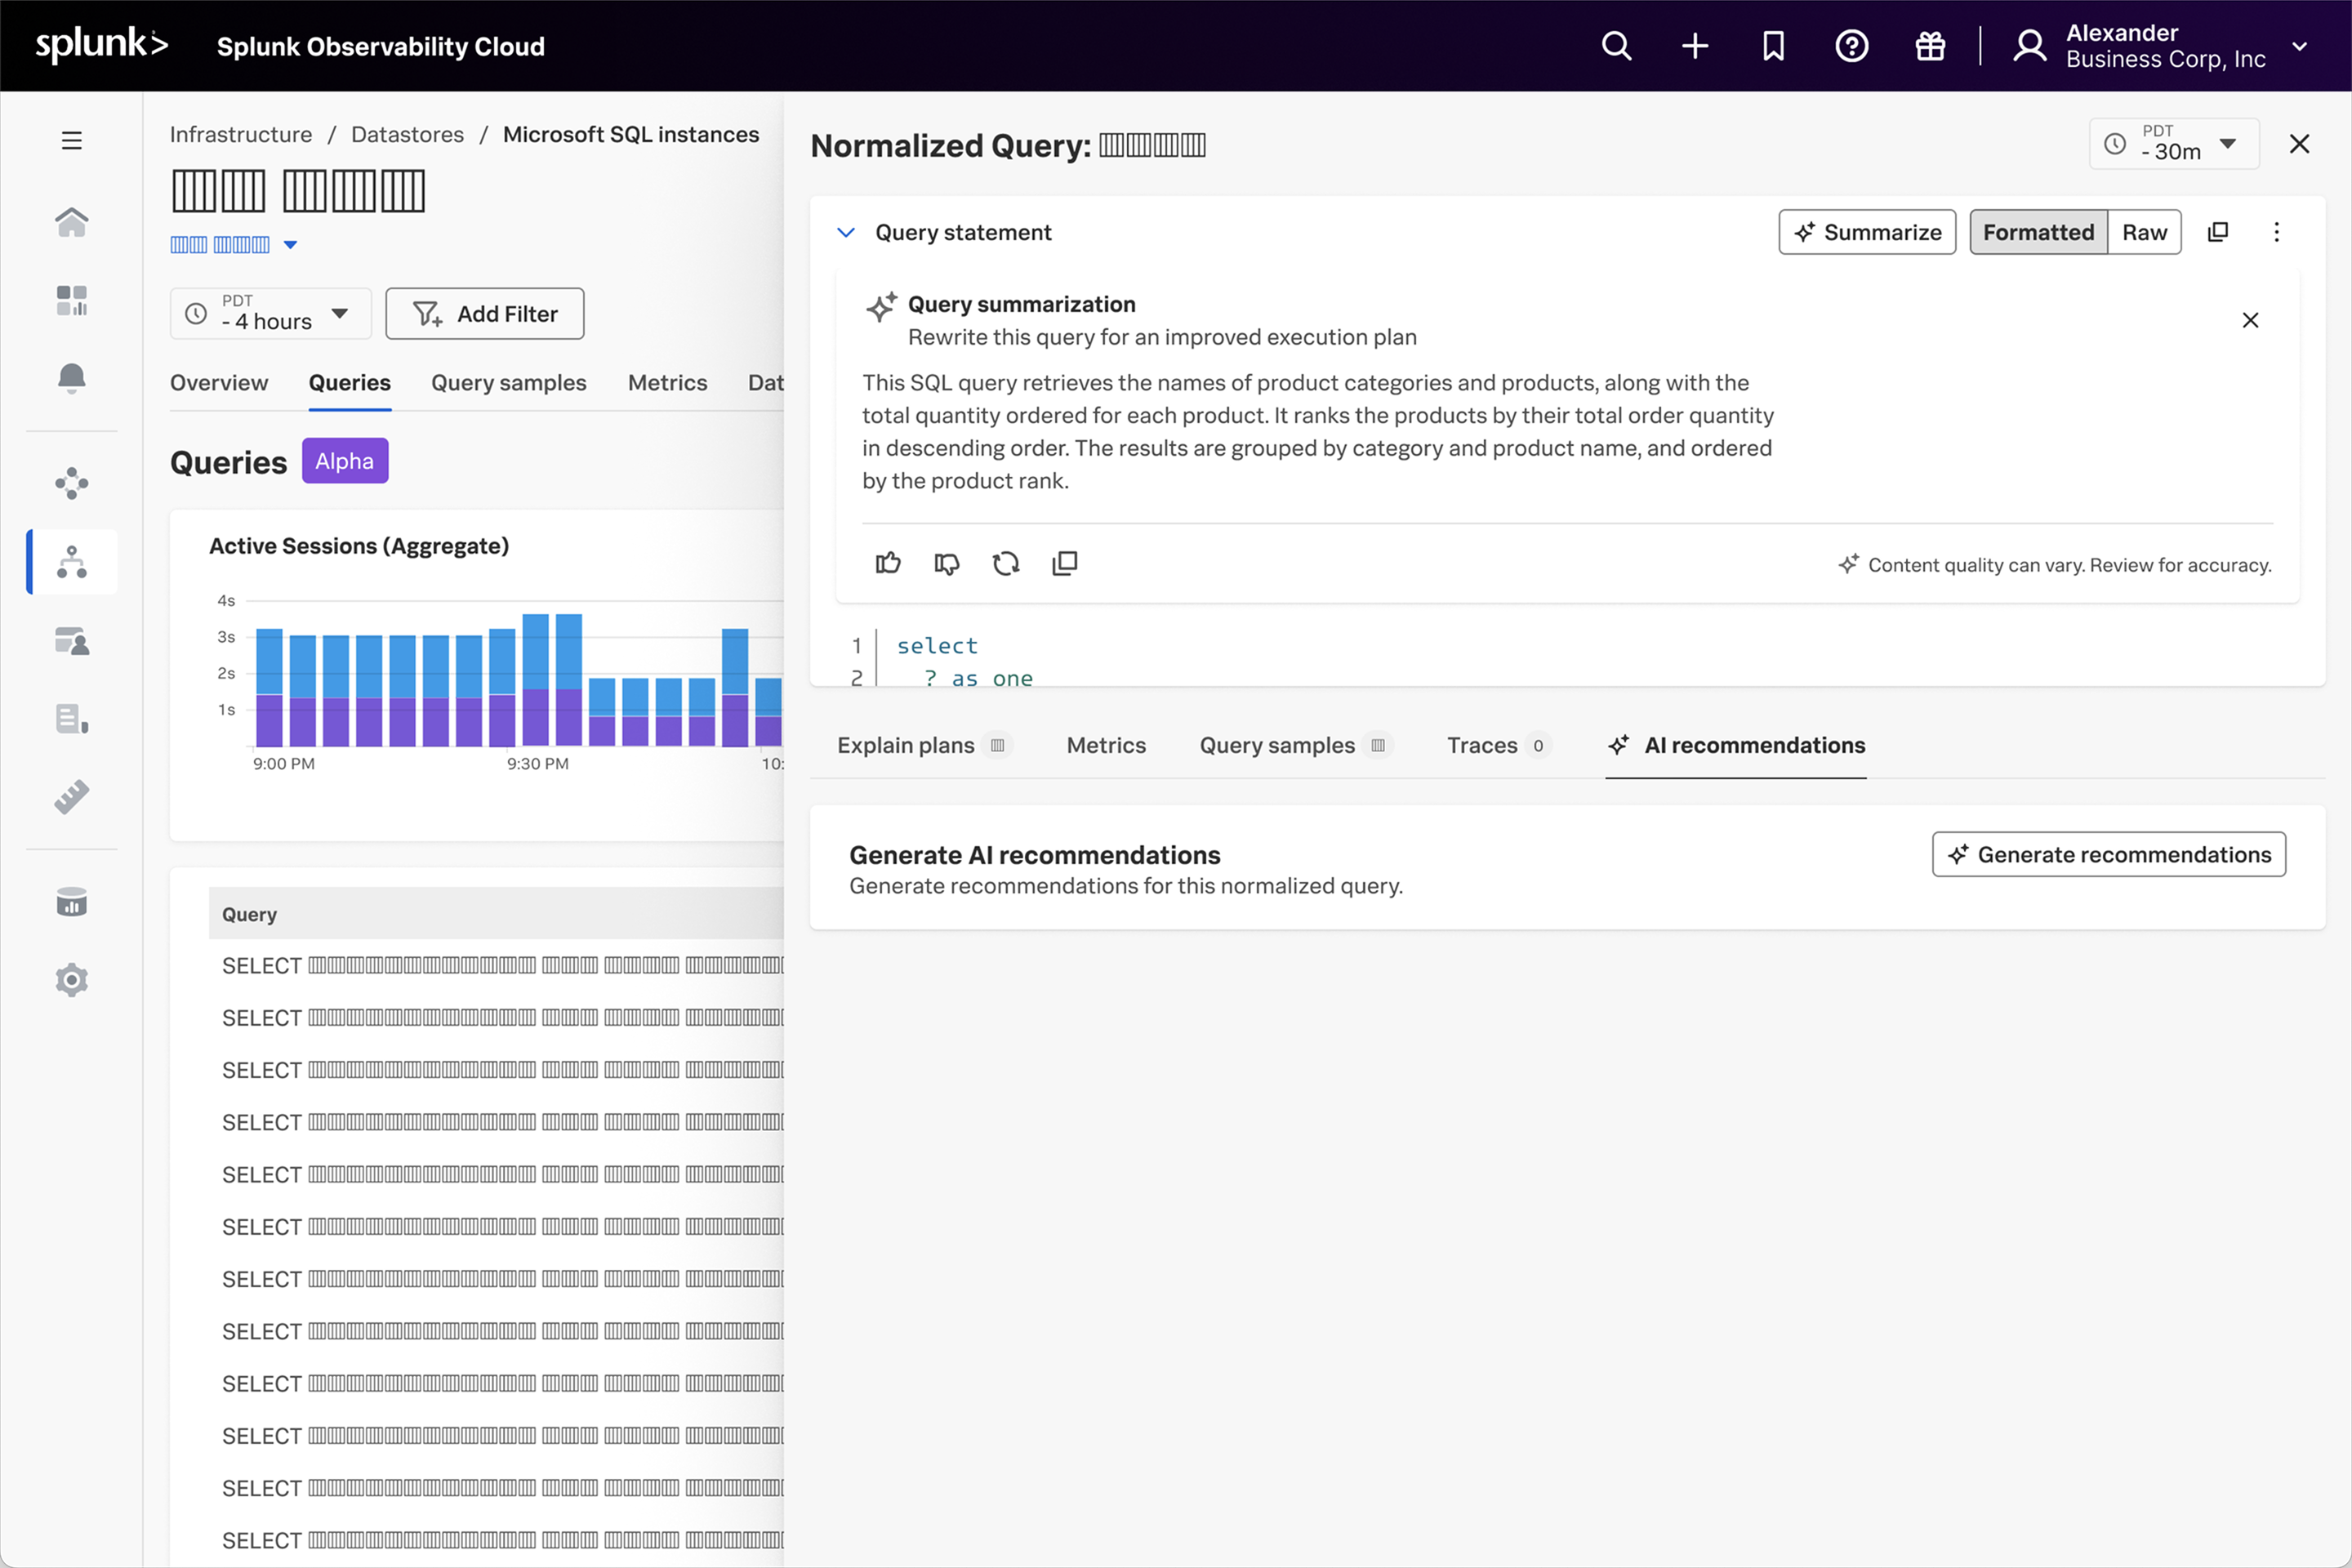
A. On demand AI-generated query summarization
Query summarization is a quick-win, highly deterministic AI-assisted solution to the problem of, “What is this SQL query trying to do?” A question that gets asked very often by SREs who are not the developers who wrote the query in the first place. This helps them figure out everything from the importance of said query, troubleshooting the query, to contacting the appropriate application team if all else fails.
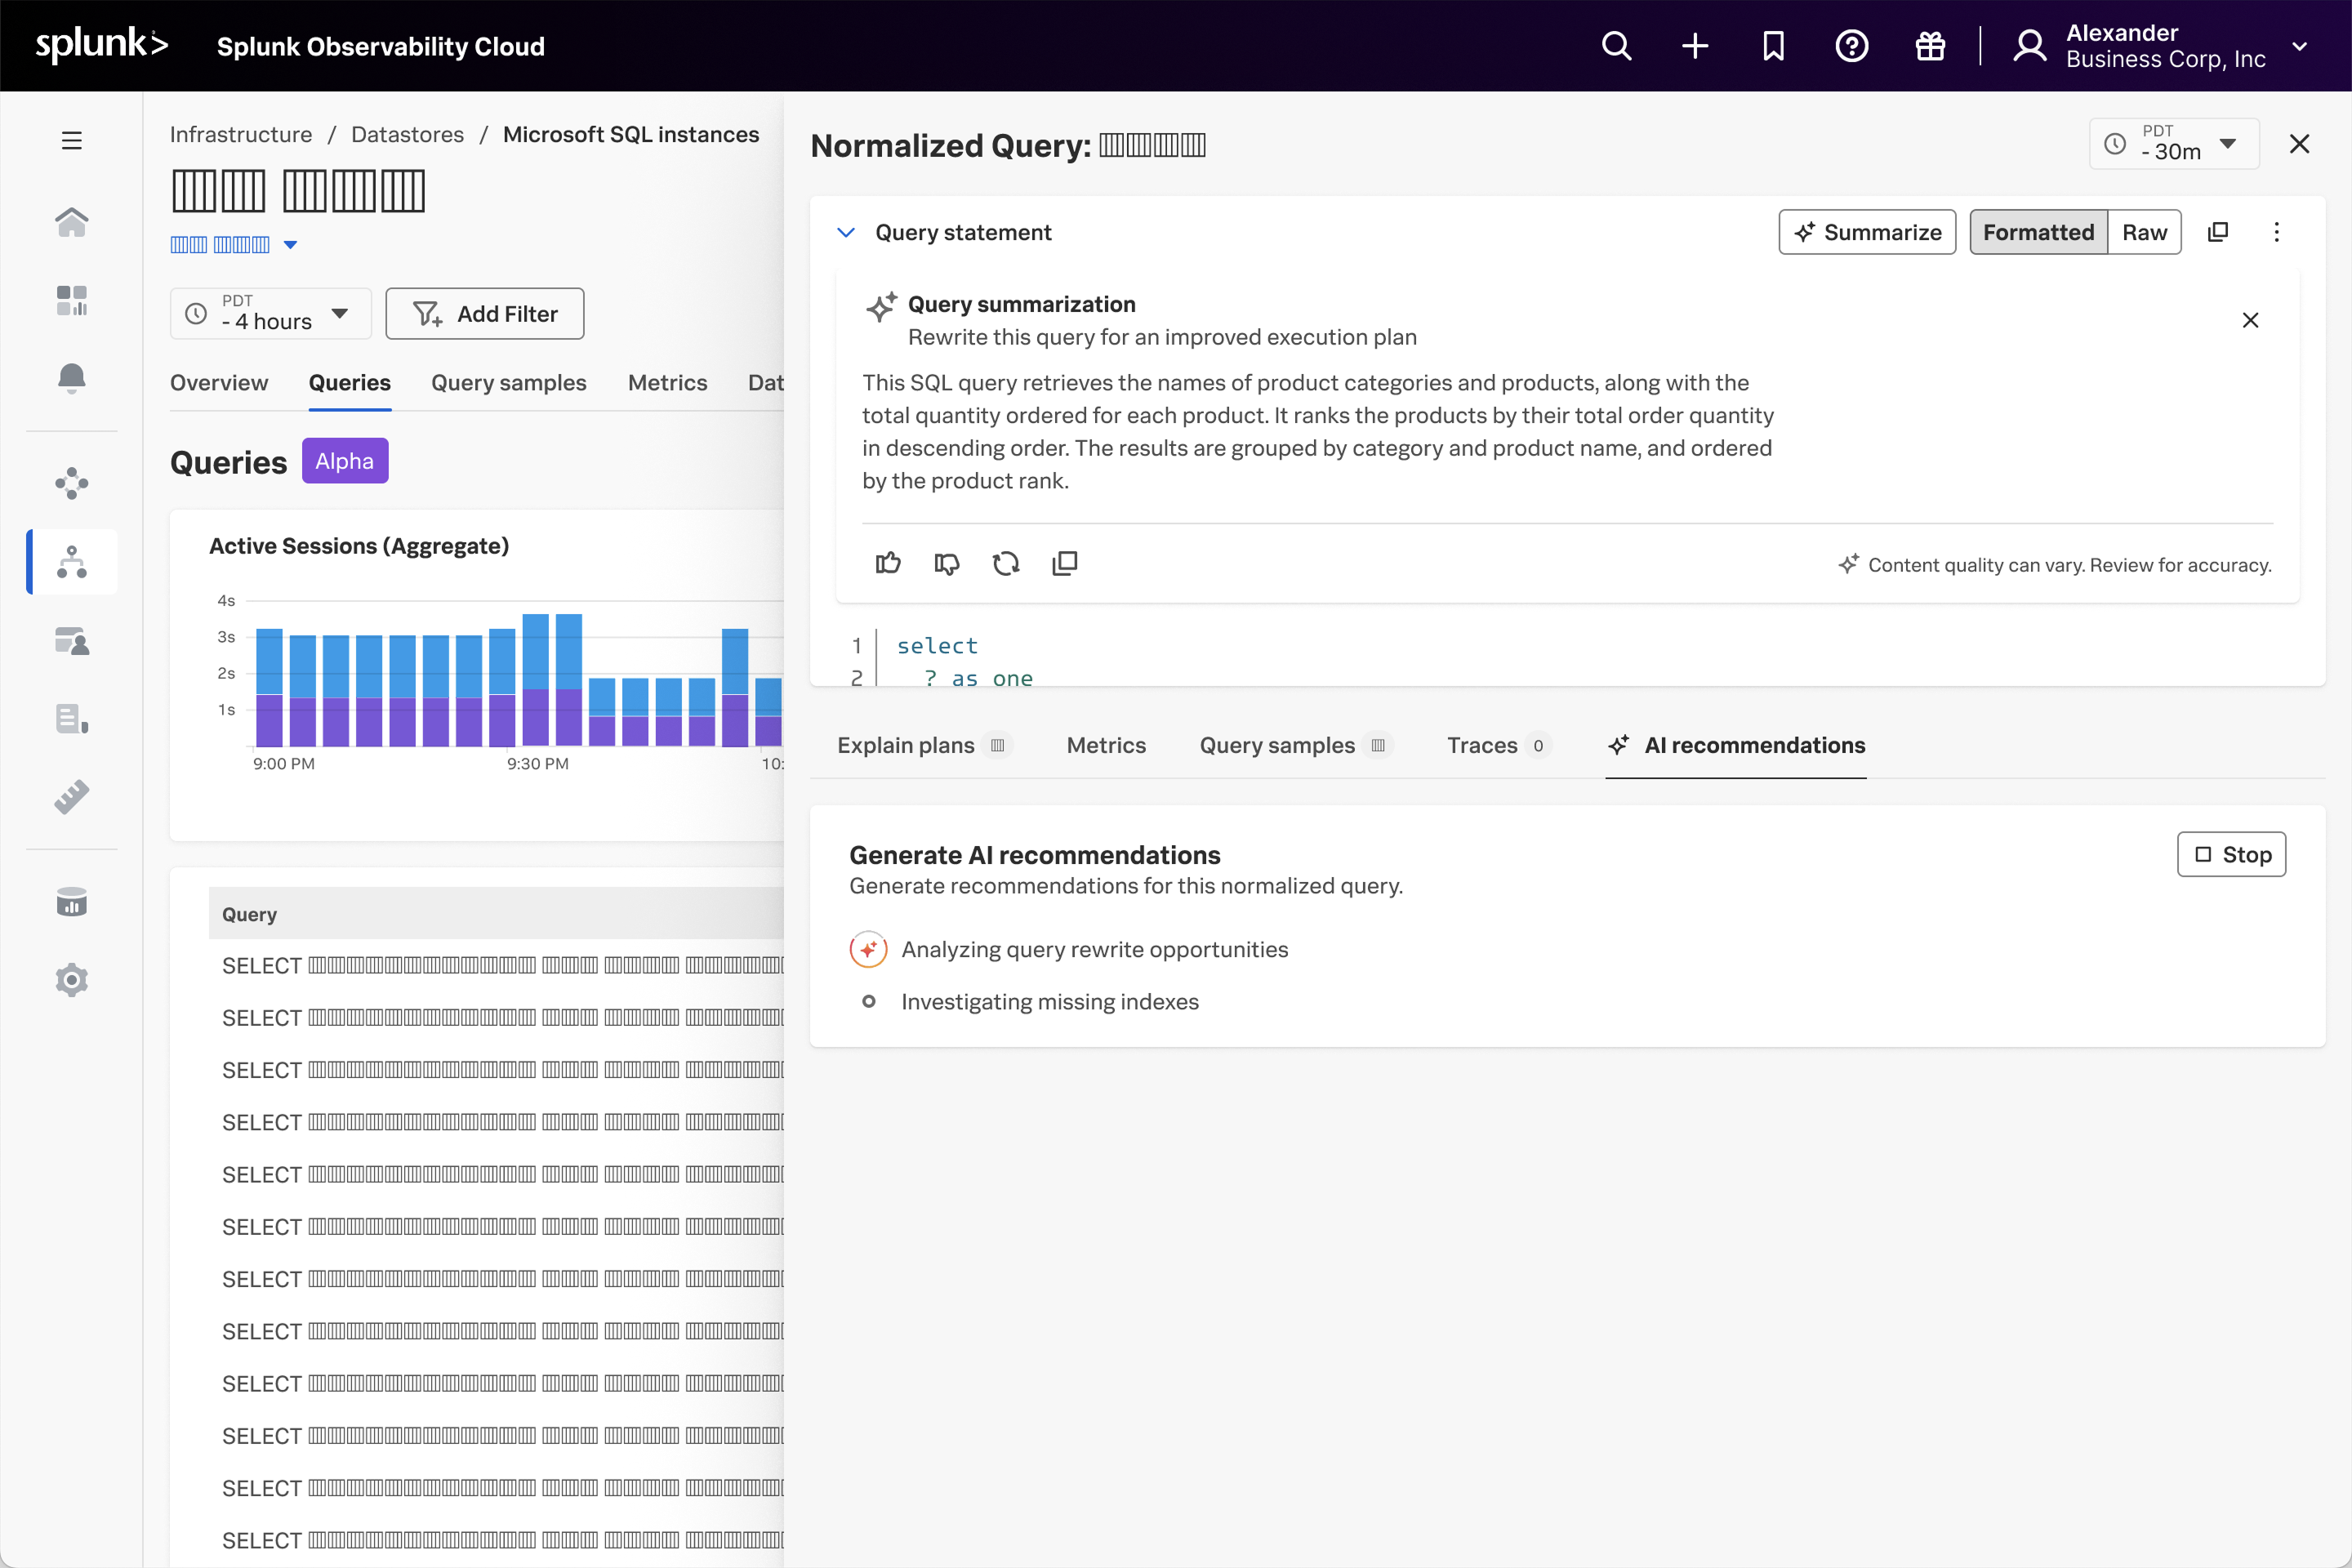
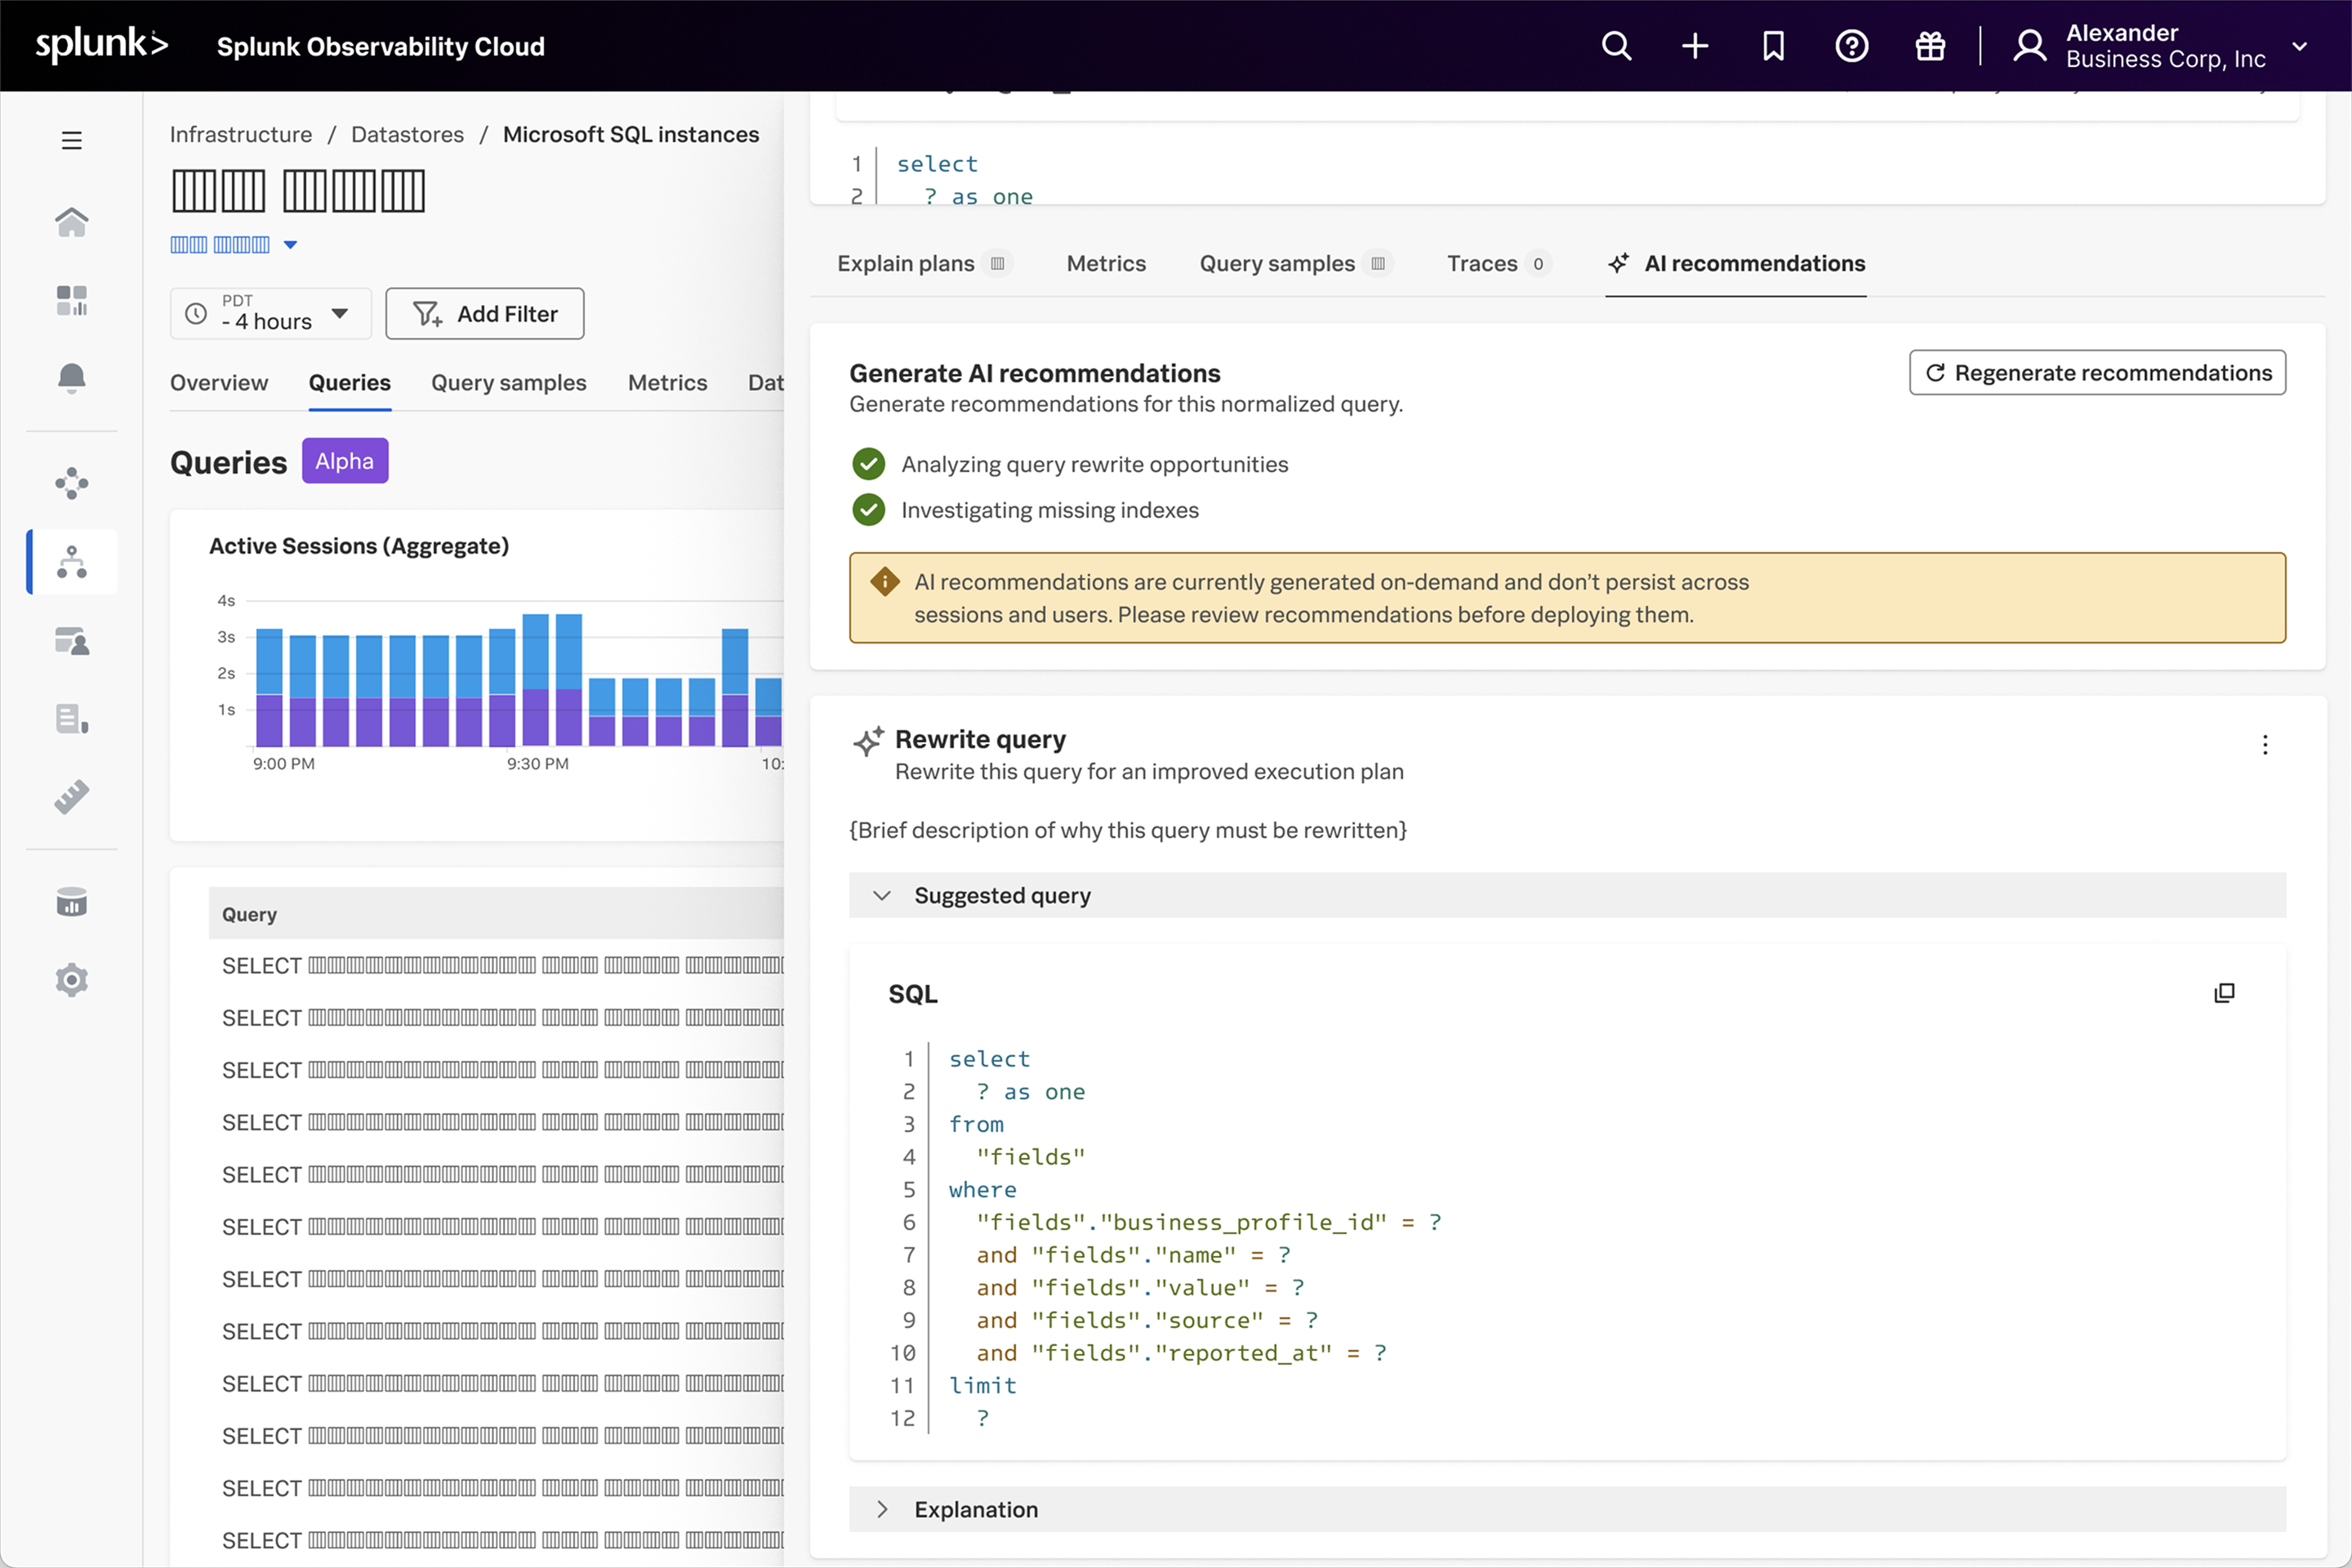
B. AI recommendations for query optimization
AI recommendations was an obvious next step to utilize AI to help users optimize their slow-running database queries. The design took into consideration that there were engineering constraints which prevented ahead-of-time AI analysis of ingested queries. Hence, the design focused on an on-demand system where users could request AI recommendations for specific queries they were investigating.
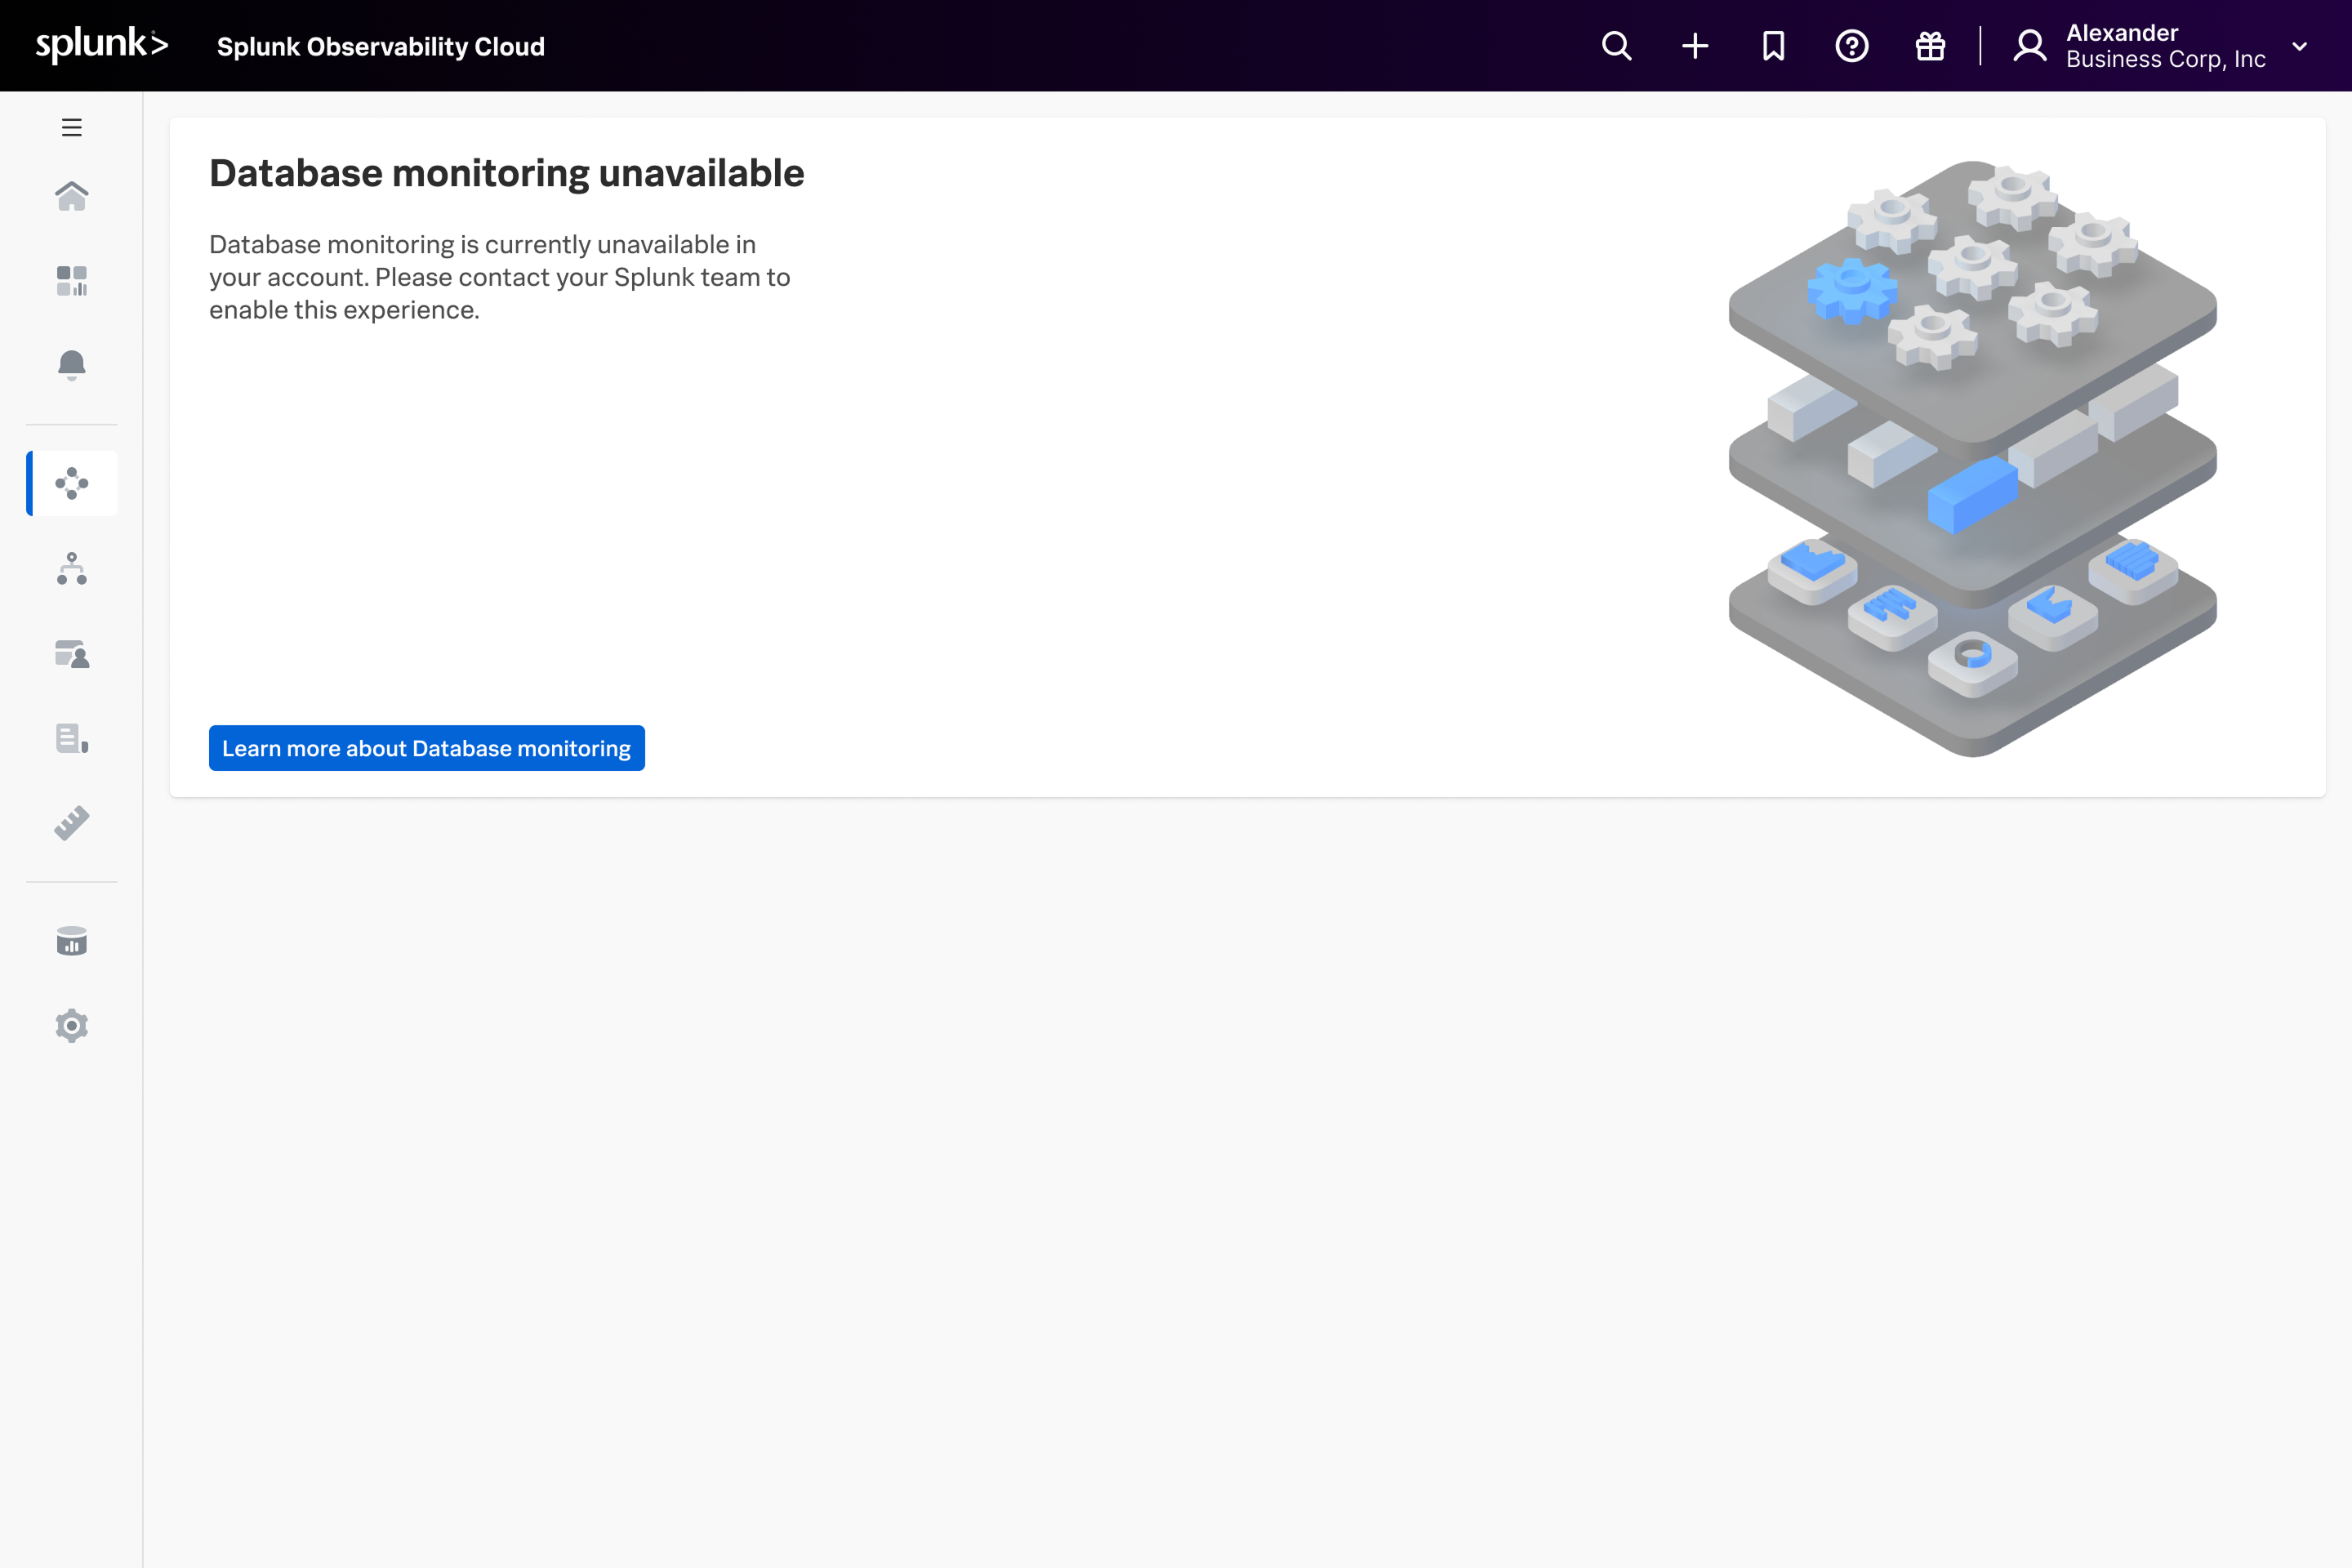
In-product marketing to enable product-led adoption
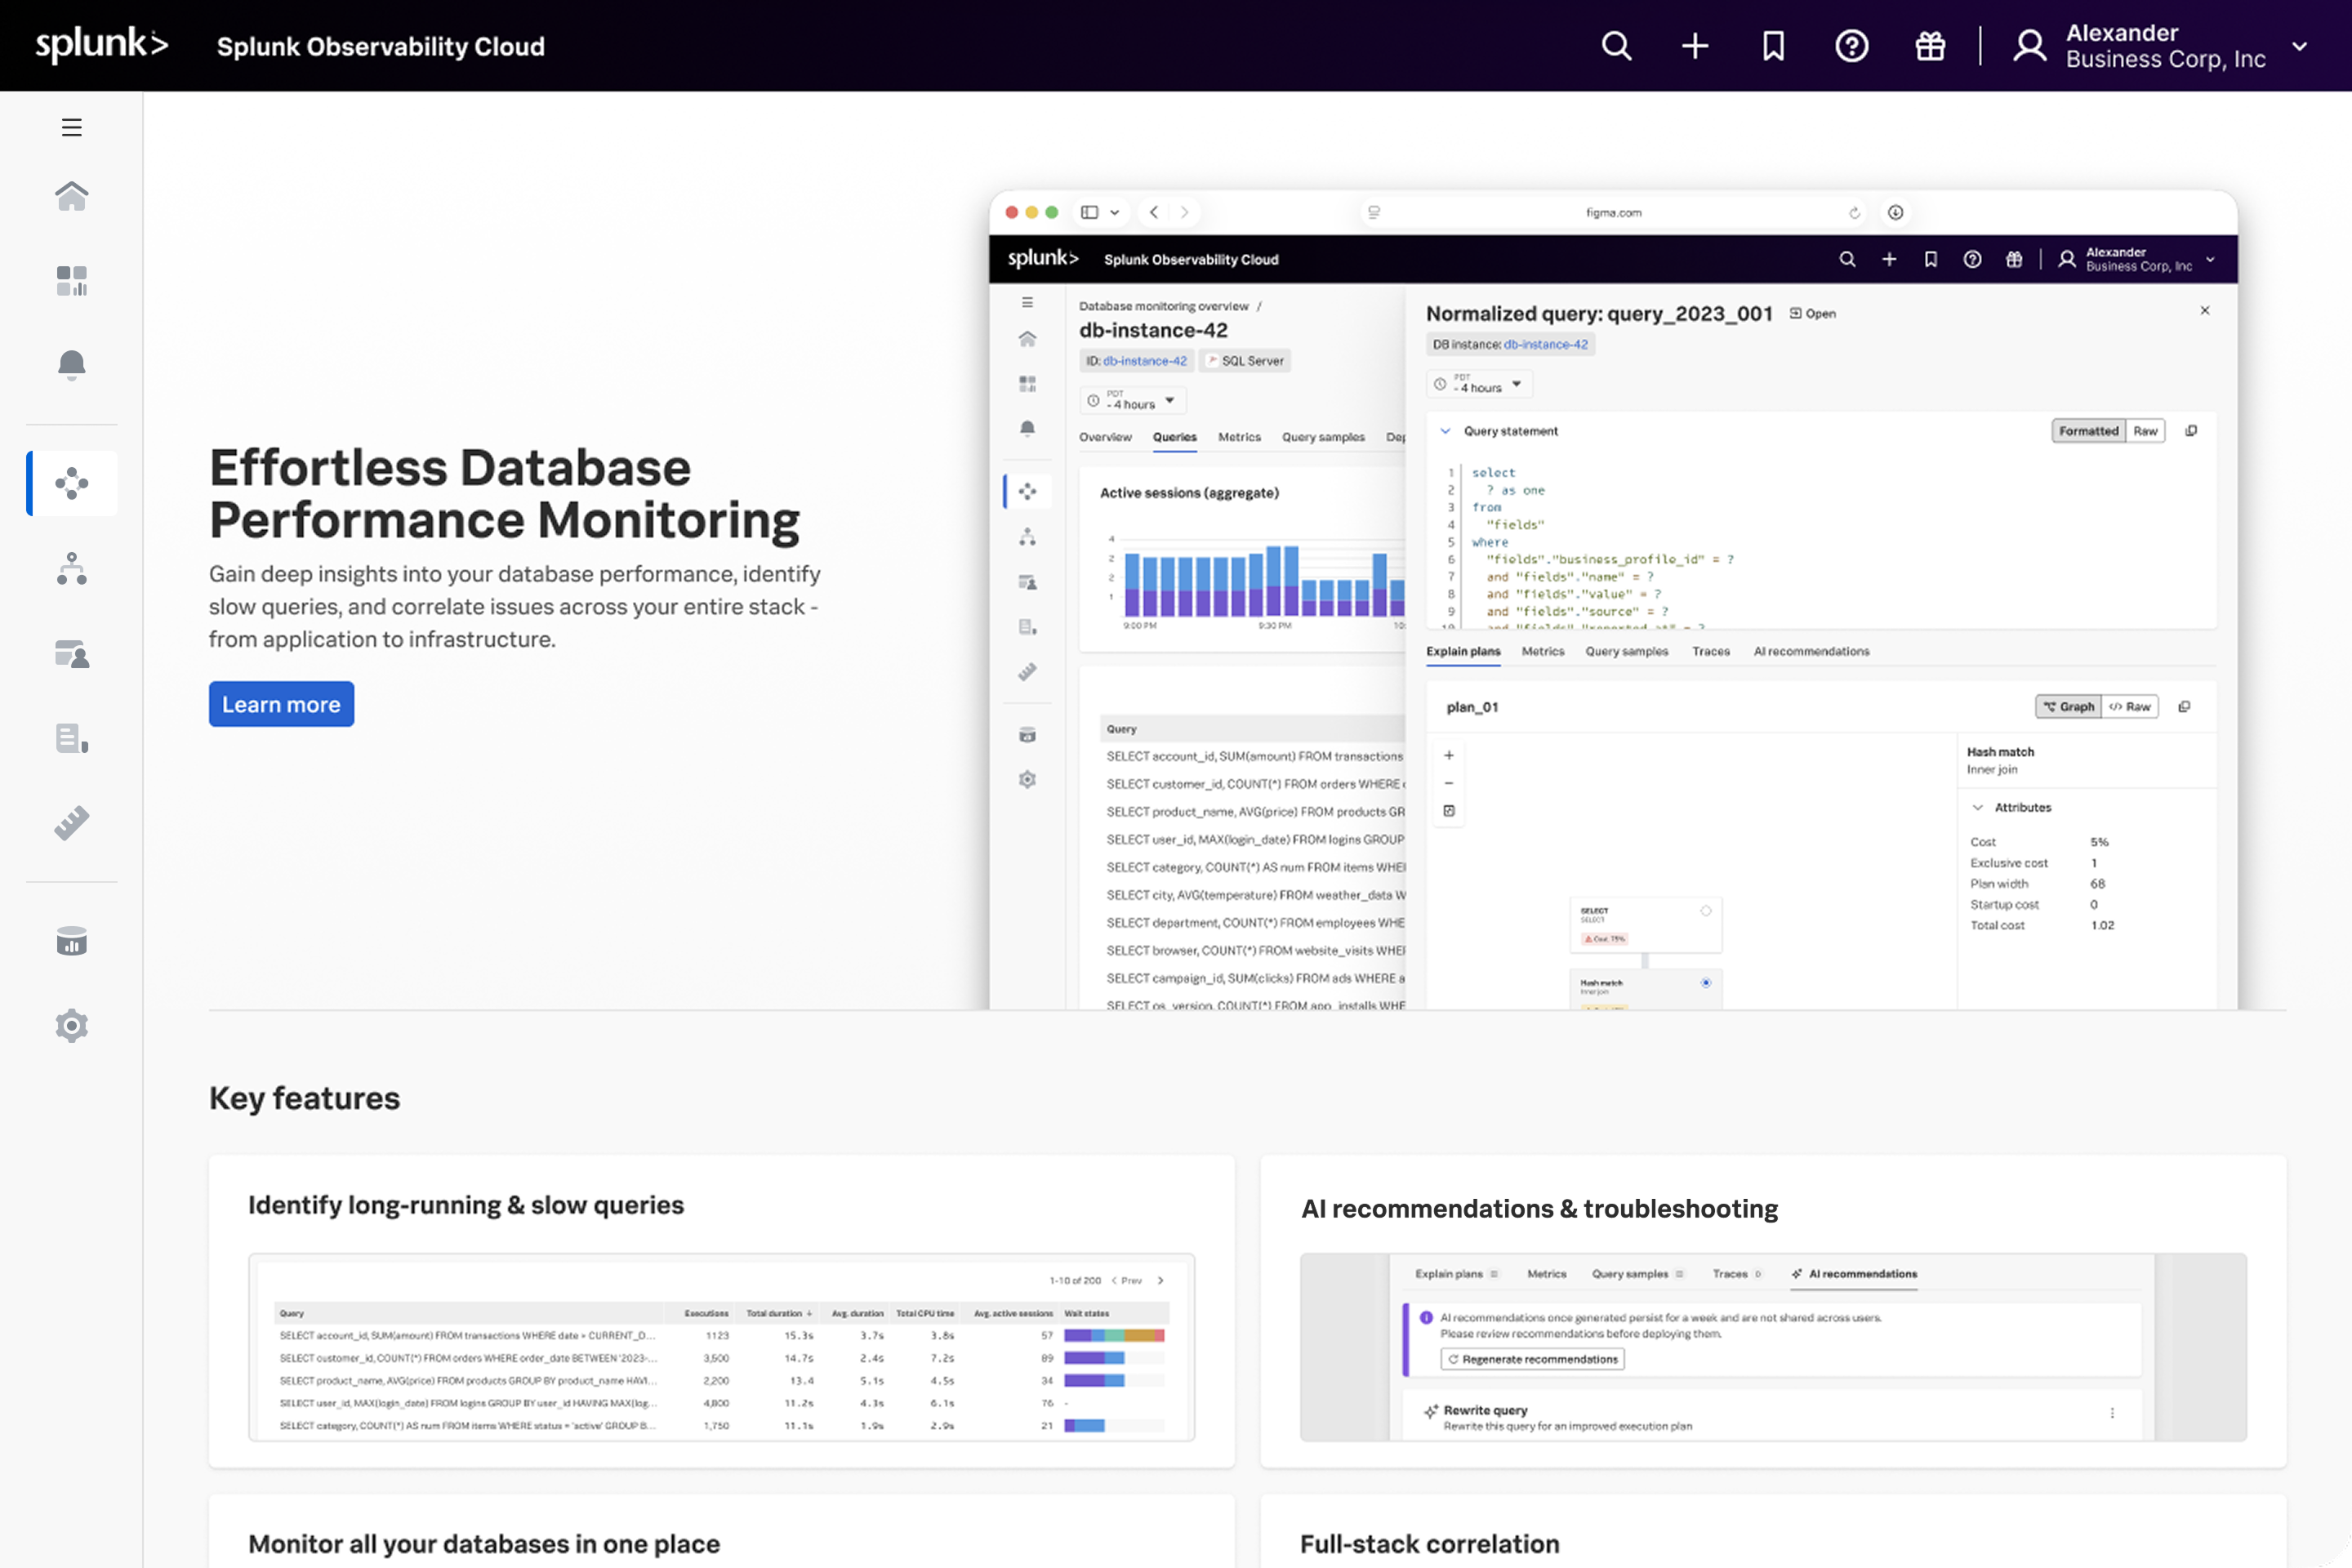
This additional initiative targeted the opportunity to educate users about database monitoring within the product itself. Instead of relying on the stark zero state that Splunk Observability Cloud was using for existing verticals, I designed an in-product marketing experience that would educate users about the value proposition of database monitoring, and encourage them to contact the sales team to enable the feature.
Prototype
This prototype takes the user from troubleshooting a trace to investigating the associated database query, and optimizing them using AI-assisted recommendations.